 Back
BackStep-by-Step Guidance for Statistics Exam Review
Study Guide - Smart Notes
 Tailored notes based on your materials, expanded with key definitions, examples, and context.
Q1. A survey of high school seniors reported that 81% of those sampled are interested in pursuing a college education. Does this statement describe descriptive or inferential statistics?
Background
Topic: Types of Statistics
This question tests your understanding of the difference between descriptive statistics (summarizing data from a sample) and inferential statistics (drawing conclusions about a population based on sample data).
Key Terms:
Descriptive statistics: Methods for summarizing and organizing data.
Inferential statistics: Methods for making predictions or generalizations about a population based on sample data.
Step-by-Step Guidance
Identify whether the statement is simply reporting the result from the sample or making a generalization about the population.
Consider if the statement is summarizing the data collected (descriptive) or using the sample to infer something about all high school seniors (inferential).
Think about the purpose of the survey: Is it to describe the sample or to make a claim about the larger group?
Try solving on your own before revealing the answer!
Q2. Parking at a large university has become a very big problem. University administrators are interested in determining the proportion of students who park in the university lots who own more than one car. They randomly select 200 students who park in the university lots and ask each how many cars he or she owns. Is this an example of descriptive or inferential statistics?
Background
Topic: Types of Statistics
This question is about identifying whether the process described is collecting and summarizing data (descriptive) or using the sample to make a statement about the entire population (inferential).
Key Terms:
Sample: A subset of the population selected for study.
Population: The entire group of individuals relevant to the study.
Step-by-Step Guidance
Determine if the administrators are only reporting the proportion from the sample or making a generalization about all students who park in university lots.
Ask yourself: Is the result intended to describe the sample or to infer something about the population?
Consider the wording of the question and whether it implies a broader conclusion.
Try solving on your own before revealing the answer!
Q3. An automotive company conducted a survey to determine the percentage of car dealerships who have had more than 10 salespeople quit in the past year. The company randomly selected 50 dealerships from a national directory of dealerships and asked each how many salespeople had quit in the past year. Is this an example of descriptive or inferential statistics?
Background
Topic: Types of Statistics
This question tests your ability to distinguish between summarizing sample data and making inferences about the population of all car dealerships.
Key Terms:
Random sample: A sample chosen so that every member of the population has an equal chance of being selected.
Descriptive vs. Inferential: Are the results describing the sample or inferring about the population?
Step-by-Step Guidance
Identify if the survey results are being used to describe the sample or to make a statement about all dealerships.
Look for clues in the question that indicate whether the company is generalizing beyond the sample.
Think about the implications of the survey and whether it is meant to inform about the population.
Try solving on your own before revealing the answer!
Q4. A researcher is interested in how job satisfaction varies by industry. University administrators are interested in determining the proportion of students who park in the university lots who own more than one car. They randomly select 200 students who park in the university lots and ask each how many cars he or she owns. Is this an example of descriptive or inferential statistics?
Background
Topic: Types of Statistics
This question is similar to Q2 and tests your understanding of whether the process is descriptive or inferential.
Key Terms:
Descriptive statistics: Summarizing sample data.
Inferential statistics: Making predictions about the population.
Step-by-Step Guidance
Review the scenario and determine if the researcher is summarizing the sample or making a generalization about the population.
Consider the purpose of the study and whether it is meant to describe or infer.
Think about the difference between reporting sample results and making population-level claims.
Try solving on your own before revealing the answer!
Q5. The group of interest in a particular study is called the:
Background
Topic: Populations and Samples
This question tests your knowledge of basic terminology in statistics, specifically the difference between a population and a sample.
Key Terms:
Population: The entire group that is the subject of a statistical study.
Sample: A subset of the population used to make inferences about the population.
Step-by-Step Guidance
Recall the definitions of population and sample.
Identify which term refers to the group the study is focused on.
Think about how samples are used to represent populations in statistics.
Try solving on your own before revealing the answer!
Q6. True or False: A parameter is a numerical summary of a sample.
Background
Topic: Parameters vs. Statistics
This question tests your understanding of the difference between a parameter (population summary) and a statistic (sample summary).
Key Terms:
Parameter: A numerical summary of a population.
Statistic: A numerical summary of a sample.
Step-by-Step Guidance
Recall the definitions of parameter and statistic.
Determine which term applies to a sample and which to a population.
Think about the role of each in statistical analysis.
Try solving on your own before revealing the answer!
Q7. A sample of 1000 letters mailed within the United States was randomly selected by the United States Postal Service to determine the proportion of all letters mailed within the United States that are delivered within three days. Is this an example of descriptive or inferential statistics?
Background
Topic: Types of Statistics
This question tests your ability to distinguish between describing sample data and making inferences about the population.
Key Terms:
Descriptive statistics: Summarizing sample data.
Inferential statistics: Making predictions about the population.
Step-by-Step Guidance
Identify if the result is describing the sample or inferring about all letters mailed in the US.
Consider the purpose of the study and whether it is meant to describe or infer.
Think about the difference between reporting sample results and making population-level claims.
Try solving on your own before revealing the answer!
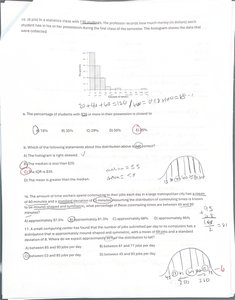
Q8. In a statistics class with 12 students, the professor records how much money (in dollars) each student has in his or her wallet. The histogram shows the data that were collected.
Background
Topic: Data Visualization and Interpretation
This question tests your ability to interpret a histogram and understand the distribution of data.
Key Terms:
Histogram: A graphical representation of the distribution of numerical data.
Frequency: The number of times a value appears in the data set.
Step-by-Step Guidance
Examine the histogram and identify the frequency of each dollar amount range.
Calculate the total number of students in each range to determine percentages.
Use the frequencies to answer questions about the distribution.
Try solving on your own before revealing the answer!
Q9. Which of the following statements best describes the distribution above?
Background
Topic: Distribution Shapes
This question tests your ability to recognize the shape of a distribution from a histogram.
Key Terms:
Right-skewed: The tail on the right side of the distribution is longer.
Left-skewed: The tail on the left side is longer.
Symmetric: Both sides are approximately equal.
Step-by-Step Guidance
Look at the histogram and identify where most of the data are concentrated.
Determine if the distribution has a longer tail on the right or left.
Compare the frequencies to decide if the distribution is skewed or symmetric.
Try solving on your own before revealing the answer!
Q10. The amount of money students spent (according to their wallet data) was fit to a normal curve. Which of the following statements is true about the mean and median?
Background
Topic: Measures of Central Tendency
This question tests your understanding of the relationship between mean and median in different types of distributions.
Key Terms:
Mean: The average value.
Median: The middle value when data are ordered.
Normal distribution: A symmetric, bell-shaped distribution.
Step-by-Step Guidance
Recall that in a normal distribution, the mean and median are equal.
Consider how skewness affects the relationship between mean and median.
Think about the implications for the data set described.
Try solving on your own before revealing the answer!
Final Answers
Q1: Descriptive statistics. The statement summarizes the sample data.
Q2: Inferential statistics. The administrators are making a generalization about all students.
Q3: Inferential statistics. The company is inferring about all dealerships.
Q4: Inferential statistics. The researcher is making a generalization about the population.
Q5: Population. The group of interest is called the population.
Q6: False. A parameter is a summary of a population, not a sample.
Q7: Inferential statistics. The sample is used to infer about all letters mailed.
Q8: The percentage of students with $10 or more in their wallet is 50%.
Q9: The distribution is right-skewed.
Q10: In a normal distribution, the mean and median are equal.
Each answer is based on the definitions and concepts discussed in the guidance above. Review the reasoning for each to reinforce your understanding!
