 Back
BackStep-by-Step Guidance for Statistics Exam Practice
Study Guide - Smart Notes
 Tailored notes based on your materials, expanded with key definitions, examples, and context.
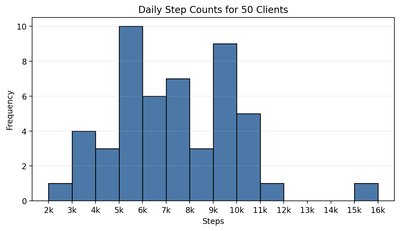
Q9. A fitness trainer recorded the daily number of steps taken by 50 clients and created the histogram shown below.
Background
Topic: Descriptive Statistics & Data Visualization
This question tests your ability to interpret histograms, describe the shape of a distribution, and use visual data to answer statistical questions.
Key Terms:
Histogram: A graphical representation of the distribution of numerical data.
Distribution Shape: Describes how data values are spread (e.g., symmetric, skewed, bimodal).
Median: The middle value when data are ordered.
Percentage: Proportion of data within a specified interval.
Step-by-Step Guidance
Examine the histogram to identify the shape of the distribution. Look for symmetry, peaks, and tails.
To find the interval containing the median, recall that the median is the value at the 25th and 26th position (since there are 50 clients). Count frequencies from the left until you reach the middle values.
To determine the percentage of clients with daily steps at or below 7,000, add the frequencies for all intervals up to and including 7,000 steps. Divide this sum by the total number of clients (50), then multiply by 100 to get the percentage.
Try solving on your own before revealing the answer!
Final Answer:
(a) The distribution is bimodal, with two peaks around 5,000 and 10,000 steps. This is evident from the two tallest bars in the histogram.
(b) The interval containing the median is 7,000–8,000 steps, since the cumulative frequency reaches the middle values in this range.
(c) The percentage of clients at or below 7,000 steps is 40%. This is calculated by summing the frequencies for all intervals up to 7,000 steps and dividing by 50.
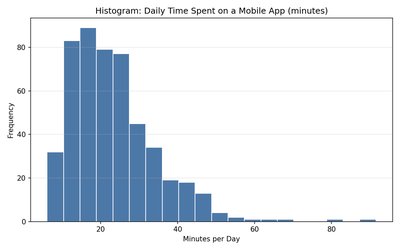
Q11. A histogram shows the number of minutes users spend on a mobile app per day.
Background
Topic: Distribution Shape & Measures of Central Tendency
This question tests your ability to interpret histograms and compare the mean, median, and mode based on the shape of the distribution.
Key Terms:
Skewness: Describes whether the distribution has a longer tail on one side.
Mean: The average value.
Median: The middle value.
Mode: The most frequent value.
Step-by-Step Guidance
Look at the histogram to determine the shape. Is it symmetric, skewed left, or skewed right?
Recall how the mean, median, and mode relate to each other in a skewed distribution. For example, in a right-skewed distribution, the mean is typically greater than the median, which is greater than the mode.
Identify which measure is largest and which is smallest based on the observed skewness.
Try solving on your own before revealing the answer!
Final Answer:
(a) The histogram is right-skewed (positively skewed), with a longer tail to the right.
(b) In a right-skewed distribution, the mean is largest, followed by the median, and the mode is smallest.
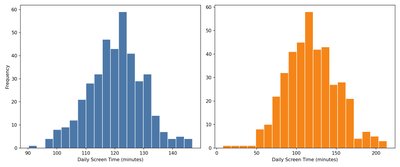
Q13. The following histograms show the daily screen time (in minutes) for two groups of students. Both groups have approximately the same mean.
Background
Topic: Variability & Standard Deviation
This question tests your ability to compare variability (dispersion) between two groups using histograms and to reason about standard deviation.
Key Terms:
Dispersion (Variability): How spread out the data are.
Standard Deviation: A measure of how much values deviate from the mean.
Histogram: Visual tool for comparing distributions.
Step-by-Step Guidance
Examine both histograms and compare the spread of values. Look for differences in the range and concentration of data.
Identify which group has values more spread out from the mean. This group will have greater dispersion.
Recall that a larger spread in the histogram corresponds to a larger standard deviation.
Try solving on your own before revealing the answer!
Final Answer:
(a) The group on the right has greater dispersion, as its values are more spread out across a wider range.
(b) The standard deviation for the group on the right would be larger, since its data are more variable.
