 Back
BackStep-by-Step Guidance for Statistics Quiz #1 (Chapters 1–3)
Study Guide - Smart Notes
 Tailored notes based on your materials, expanded with key definitions, examples, and context.
Q1. How many dorm residents should be drawn from each class level for a stratified random sample of size 100?
Background
Topic: Stratified Sampling
This question tests your understanding of how to allocate sample sizes proportionally across strata (groups) in a population, based on their sizes.
Key Terms and Formulas:
Stratum: A subgroup of the population (here, class level: Freshmen, Sophomore, Junior, Senior).
Proportional allocation formula:
Where:
= sample size for stratum
= population size for stratum
= total population size
= total sample size
Step-by-Step Guidance
Calculate the total number of dorm residents:
Find the proportion of each class level: , , etc.
Multiply each proportion by the planned sample size () to get the number to sample from each class:
Round each to the nearest whole number if needed, ensuring the total adds up to 100.
Try solving on your own before revealing the answer!
Final Answer:
Freshmen: 32, Sophomore: 28, Junior: 24, Senior: 12
Each class's sample size is proportional to its population size, ensuring fair representation in the study.
Q2. Do you agree or disagree with the conclusion that Trump will be less likely to win the presidency election in 2024 based on the poll results?
Background
Topic: Sampling Bias and Generalizability
This question tests your ability to evaluate whether a sample is representative of the population and whether conclusions drawn from the sample are valid.
Key Terms:
Sampling bias: When the sample does not accurately represent the population.
Generalizability: The extent to which results from a sample can be applied to the broader population.
Step-by-Step Guidance
Identify the population sampled: Only people from California and Florida.
Consider whether these states are representative of the entire U.S. voting population.
Think about potential regional differences in voting preferences.
Assess whether the sample size and selection method allow for valid national conclusions.
Try solving on your own before revealing the answer!
Final Answer:
Disagree. The sample is not representative of the entire U.S. population, so the conclusion about the national election is not valid.
Sampling only from two states introduces bias and limits generalizability.
Q3. What type of data is presented in the 1st column? 2nd column? 3rd column?
Background
Topic: Types of Data
This question tests your ability to classify data as qualitative (categorical) or quantitative (numerical), and to distinguish between different levels of measurement.
Key Terms:
Qualitative (categorical) data: Describes categories or groups.
Quantitative (numerical) data: Measures or counts quantities.
Ordinal, nominal, interval, ratio: Levels of measurement.
Step-by-Step Guidance
Examine the 1st column (Rank): Is it a number representing order or quantity?
Examine the 2nd column (Company): Is it a name or a number?
Examine the 3rd column (IPO): Is it a numerical value, and what does it represent?
Classify each column as qualitative or quantitative, and specify the level of measurement.
Try solving on your own before revealing the answer!
Final Answer:
1st column: Ordinal (Rank), 2nd column: Nominal (Company name), 3rd column: Ratio (IPO value).
Rank is ordered, company is categorical, IPO is numerical with a true zero.
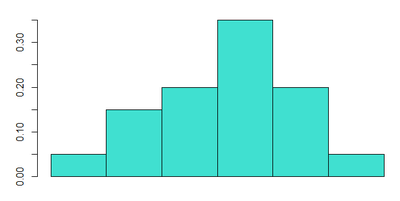
Q4. What percentage of patients have cholesterol levels of 215 or higher? What percentage have cholesterol levels between 205 and 209 inclusive?
Background
Topic: Frequency and Relative Frequency Histograms
This question tests your ability to interpret histograms and calculate percentages based on relative frequencies.
Key Terms and Formulas:
Relative frequency: The proportion of observations in a given interval.
Percentage calculation:
Step-by-Step Guidance
Identify the bars on the histogram corresponding to cholesterol levels of 215 or higher, and those between 205 and 209.
Read the relative frequency values for these intervals from the histogram.
Add the relative frequencies for all relevant bars.
Multiply the sum by 100 to convert to percentage.
Try solving on your own before revealing the answer!
Final Answer:
(a) 20% of patients have levels of 215 or higher. (b) 20% have levels between 205 and 209 inclusive.
These percentages are calculated by summing the relevant relative frequencies from the histogram.
Q5. Find the mean, median, and mode for the top 10 wealth values.
Background
Topic: Measures of Central Tendency
This question tests your ability to calculate and interpret mean, median, and mode for a dataset.
Key Terms and Formulas:
Mean:
Median: The middle value when data is ordered.
Mode: The value that appears most frequently.
Step-by-Step Guidance
List the wealth values in order: 66, 46, 42, 31, 31, 27.9, 26.8, 26.3, 26.1, 25.
Calculate the mean: Add all values and divide by 10.
Find the median: Arrange values in order and find the middle value(s).
Identify the mode: Look for repeated values.
Try solving on your own before revealing the answer!
Final Answer:
Mean: 34.41, Median: 29.35, Mode: 31
Mean is the average, median is the middle value, mode is the most frequent value.
Q6. For the ages 21, 54, 9, 45, 51: (a) Find the range; (b) sample mean; (c) sample standard deviation.
Background
Topic: Descriptive Statistics
This question tests your ability to compute basic descriptive statistics for a small sample.
Key Terms and Formulas:
Range:
Sample mean:
Sample standard deviation:
Step-by-Step Guidance
Identify the maximum and minimum ages to find the range.
Calculate the mean by summing all ages and dividing by 5.
Compute the squared differences from the mean for each age.
Sum the squared differences and divide by 4 (since ), then take the square root for the standard deviation.
Try solving on your own before revealing the answer!
Final Answer:
(a) Range: 45, (b) Mean: 36, (c) Standard deviation: 19.6
Range is the difference between max and min, mean is the average, standard deviation measures spread.
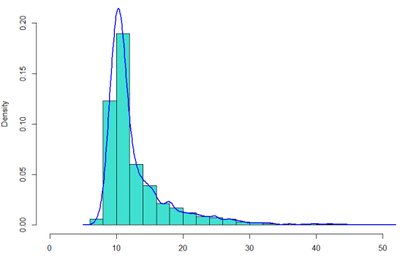
Q7. What’s the type of skewness for the biomarker’s distribution? Is the mean greater or less than the median? Why?
Background
Topic: Skewness and Measures of Central Tendency
This question tests your ability to interpret histograms and density curves to determine skewness and the relationship between mean and median.
Key Terms:
Skewness: Direction of the tail in a distribution.
Mean vs. Median: In a right-skewed distribution, mean > median; in left-skewed, mean < median.
Step-by-Step Guidance
Examine the histogram and density curve for the biomarker.
Identify the direction of the tail (right or left).
Recall the relationship between mean and median for skewed distributions.
Apply this relationship to the observed distribution.
Try solving on your own before revealing the answer!
Final Answer:
The distribution is right-skewed. The mean is greater than the median because the long right tail pulls the mean upward.
Q8. Based on the Empirical Rule, make statements about the brain weight observations in terms of 1, 2, and 3 standard deviations.
Background
Topic: Empirical Rule (68-95-99.7 Rule)
This question tests your ability to apply the Empirical Rule to a normal distribution.
Key Terms and Formulas:
Empirical Rule: For normal distributions, about 68% of data falls within 1 SD, 95% within 2 SD, 99.7% within 3 SD.
Standard deviation:
Mean:
Step-by-Step Guidance
Identify the mean ( kg) and standard deviation ( kg).
Calculate the intervals for 1, 2, and 3 standard deviations from the mean: , , .
State the percentage of observations expected within each interval according to the Empirical Rule.
Apply these intervals to the context of brain weights.
Try solving on your own before revealing the answer!
Final Answer:
About 68% of brain weights are between 1.29 and 1.51 kg, 95% between 1.18 and 1.62 kg, and 99.7% between 1.07 and 1.73 kg.
These intervals are calculated using the Empirical Rule for a normal distribution.
Q9. Compare Pleasant vs. Unpleasant memory recall times using box plots: variation, median, IQR. Which recall time tends to be longer?
Background
Topic: Box Plots and Comparative Statistics
This question tests your ability to interpret box plots and compare distributions based on variation, median, and interquartile range (IQR).
Key Terms:
Variation: Spread of the data.
Median: Middle value.
IQR: Interquartile range, difference between Q3 and Q1.
Step-by-Step Guidance
Observe the box plots for pleasant and unpleasant recall times.
Compare the medians: Which group has a higher median?
Compare the IQRs: Which group has a larger IQR?
Assess the overall variation and which recall time tends to be longer.
Try solving on your own before revealing the answer!
Final Answer:
Unpleasant memory recall times tend to be longer, with higher median and greater variation (IQR) compared to pleasant recall times.
The box plot shows a higher median and wider spread for unpleasant memories.
