 Back
BackSTK110 Study Notes: Data, Statistics, and Sampling
Study Guide - Smart Notes
 Tailored notes based on your materials, expanded with key definitions, examples, and context.
Data, Statistics, and Sampling
Introduction to Statistics and Data Collection
Statistics is the science of collecting, analyzing, interpreting, and presenting data. The research process typically involves identifying a question, collecting relevant data, analyzing the data, and forming conclusions. Understanding the types of data and methods of sampling is foundational for statistical analysis.
Key Concepts in Data and Statistics
Data: Facts and figures collected for analysis and interpretation. A data set is all the data collected in a particular study.
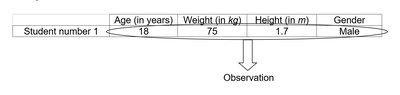
Elements: The entities on which data are collected (e.g., students).
Variables: Characteristics of interest for the elements (e.g., age, weight).
Observation: A set of measurements obtained for a particular element.
Example: Collecting age and weight for five students forms a data set with students as elements, age and weight as variables, and each row as an observation.
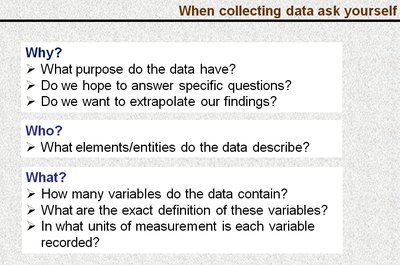
When Collecting Data: Key Questions
Why? What is the purpose of the data? What questions are being answered?
Who? What elements/entities are described?
What? How many variables are there? What are their definitions and units?
Types of Data and Measurement Scales
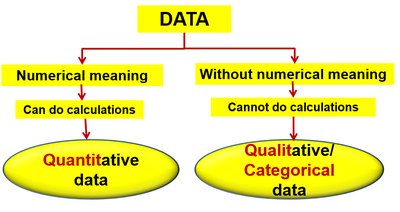
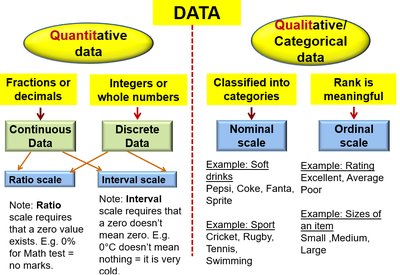
Quantitative vs. Qualitative Data
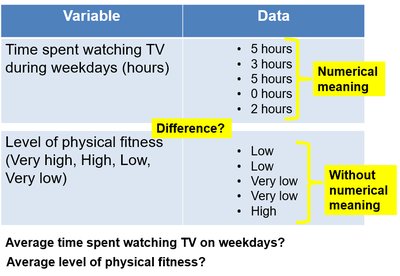
Variables can be classified as quantitative (numerical) or qualitative (categorical). Quantitative data allows for arithmetic operations, while qualitative data is descriptive and cannot be used for calculations.
Quantitative Data: Numerical values (e.g., hours spent watching TV).
Qualitative Data: Categories or labels (e.g., level of physical fitness).
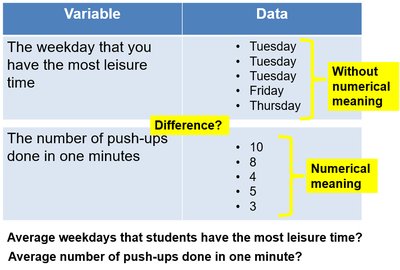
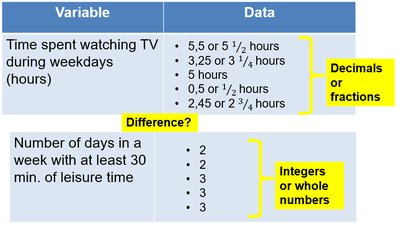
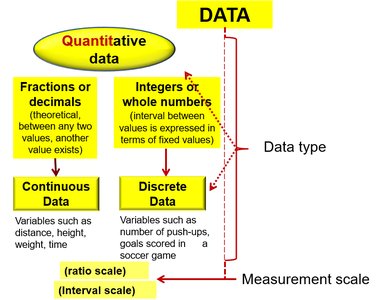
Discrete vs. Continuous Data
Discrete Data: Countable values, often integers (e.g., number of push-ups).
Continuous Data: Measurable values, can take any value within a range (e.g., time, weight).
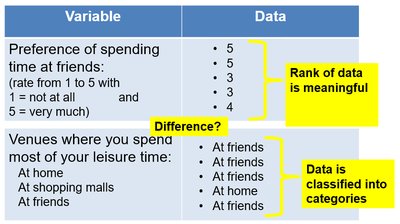
Measurement Scales
Nominal Scale: Labels or names used to identify attributes (e.g., venue).
Ordinal Scale: Data with meaningful order or rank (e.g., preference ratings).
Interval Scale: Ordered data with meaningful intervals, but no true zero (e.g., temperature).
Ratio Scale: Ordered data with meaningful intervals and a true zero (e.g., weight).
Cross-sectional and Time Series Data
Definitions
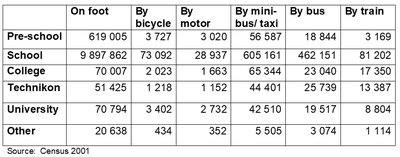
Cross-sectional Data: Data collected at a single point in time (e.g., survey responses).
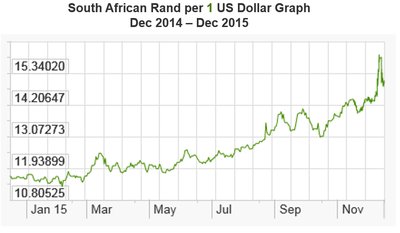
Time Series Data: Data collected over multiple time periods (e.g., monthly exchange rates).
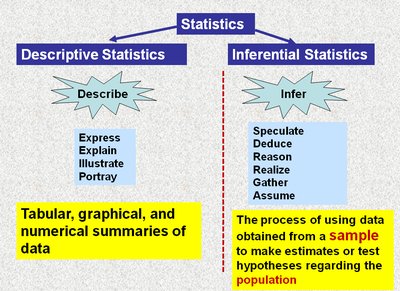
Descriptive Statistics vs. Statistical Inference
Definitions
Descriptive Statistics: Summarizing and presenting data in a form that is easy to understand (tabular, graphical, or numerical).
Statistical Inference: Using sample data to make estimates or test hypotheses about a population.
The Role of Statistics in the Research Process
Research Process Steps
Planning: Define objectives, obtain relevant information, use samples to save time and costs.
Data Collection: Gather data carefully, can be quick or lengthy depending on the study.
Editing & Coding: Eliminate errors, code data for computer entry.
Analysis: Use descriptive statistics to summarize, inferential statistics to draw conclusions.
Conclusions: Report findings, note unanswered questions, and propose further research.

Sampling Methods
Sampling Terminology
Census: Survey of all population elements.
Sample: Subset of population elements.
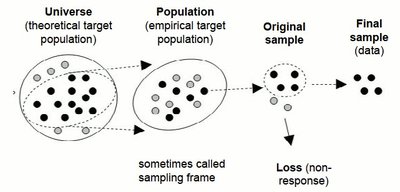
Sampling Frame: Representation of all elements in the population.
Sampling Error: Inherent inability of a sample to perfectly represent the population.
Sample Bias: Systematic exclusion or underrepresentation of certain population sections.
Observation Errors: Errors made during data collection, not due to sampling method.
Homogeneous Population: All individuals are similar for the study purpose.
Heterogeneous Population: Contains subpopulations of different types.
Probability Sampling Methods
Simple Random Sampling: Each element has an equal chance of selection. Use random number generators (e.g., Excel RAND function).
Systematic Sampling: Select every kth element after a random start. Suitable for homogeneous populations.
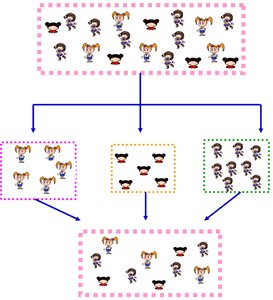
Stratified Sampling: Divide population into homogeneous strata, then sample from each stratum. Strata must be mutually exclusive and collectively exhaustive.
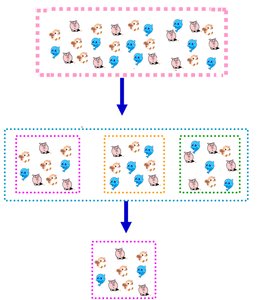
Cluster Sampling: Divide population into clusters, randomly select clusters, and use all elements in selected clusters. Clusters should be representative of the population.
Summarising Data: Tabular & Graphical Methods
Summarising Categorical Data
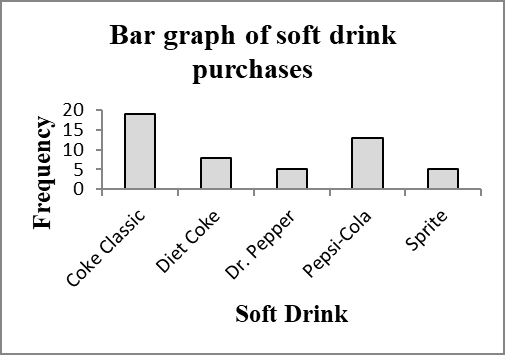
Frequency Distribution
A frequency distribution is a table showing the number of observations in each category.
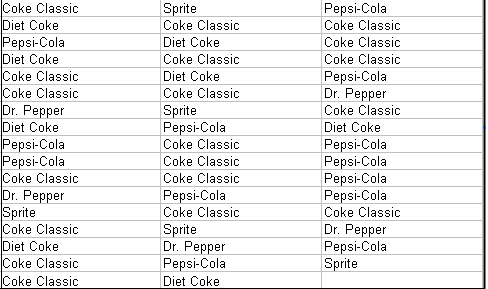
Soft Drink | Frequency |
|---|---|
Coke Classic | 19 |
Diet Coke | 8 |
Dr. Pepper | 5 |
Pepsi-Cola | 13 |
Sprite | 5 |
Total | 50 |
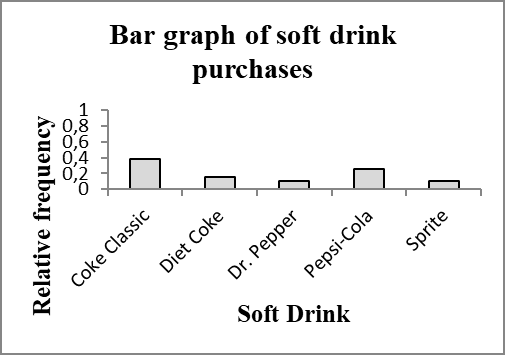
Relative and Percent Frequency Distributions
Relative frequency is the proportion of observations in each category. Percent frequency is the relative frequency multiplied by 100.
Soft Drink | Frequency | Relative Frequency | Percent Frequency |
|---|---|---|---|
Coke Classic | 19 | 0.38 | 38 |
Diet Coke | 8 | 0.16 | 16 |
Dr. Pepper | 5 | 0.10 | 10 |
Pepsi-Cola | 13 | 0.26 | 26 |
Sprite | 5 | 0.10 | 10 |
Total | 50 | 1 | 100 |
Bar Charts and Pie Charts
Bar charts and pie charts are graphical displays for summarising categorical data. Bar charts show frequencies or proportions for each category, while pie charts show the relative proportions as slices of a circle.
Summary
Understanding data types and measurement scales is essential for proper statistical analysis.
Sampling methods ensure representative data collection.
Tabular and graphical methods help summarize and interpret data effectively.
