 Back
BackLesson 2
Study Guide - Smart Notes
 Tailored notes based on your materials, expanded with key definitions, examples, and context.
Chapter 4: Gathering Data
Section 4.1: Study Design – Experiment or Observation?
Understanding how data is gathered is fundamental in statistics. The choice between conducting an experiment or merely observing can significantly affect the conclusions drawn from a study.
Population: The entire group of subjects of interest.
Sample: A subset of the population, selected for measurement.
Observational Study: The researcher observes values of variables without imposing treatments.
Experimental Study: The researcher assigns subjects to conditions (treatments) and observes outcomes.
Key Terms
Explanatory Variable: The variable manipulated or categorized to explain changes in the response variable.
Response Variable: The outcome measured in the study.
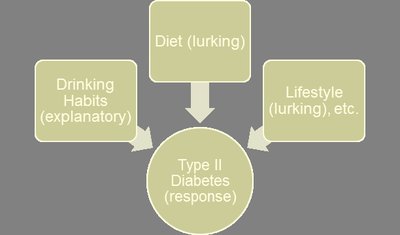
Example: Alcohol Consumption and Type II Diabetes
An observational study followed individuals for 12 years, examining the relationship between alcohol consumption and the risk of developing type II diabetes. The study found a ~30% reduced risk in moderate alcohol consumers, but no risk reduction in heavy or non-consumers.
Observational Study: No assignment of alcohol consumption schedules; researchers merely observed existing habits.
Limitation: Cannot distinguish effects of drinking from other factors (diet, lifestyle, etc.).
Comparing Experimental and Observational Studies
Experiments provide more control over outside influences and can establish cause and effect, while observational studies can only identify associations.
Experiment: Reduces potential for lurking variables.
Observational Study: Cannot establish causation.
Ethical and Practical Constraints: Sometimes experiments are not feasible.
Section 4.2: Sampling Methods
Sampling Frame & Sampling Design
The sampling design determines how subjects are selected. Ideally, every subject should have an equal chance of being chosen.
Sampling Frame: The list of subjects from which the sample is drawn.
Sampling Design: The method used to select the sample.
Simple Random Sampling (SRS)
Simple random sampling is the gold standard for obtaining a representative sample.
SRS: Each possible sample of size n has the same chance of being selected.
Random Number Table: Used to select subjects randomly.
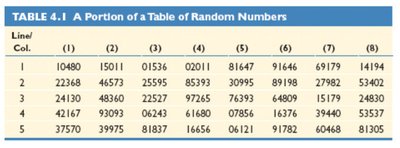
Steps to Select a SRS
Number the subjects in the sampling frame.
Select numbers from a random number table or generator.
Include subjects whose numbers match the selected random numbers.
Margin of Error
Sample surveys estimate population percentages and include a margin of error, which quantifies the uncertainty in the estimate.
Margin of Error: Indicates how well the sample estimate predicts the population percentage.
Formula (approximate):
Poor Sampling Methods: Convenience and Volunteer Samples
Convenience samples are easy to obtain but often biased and unrepresentative. Volunteer samples are a common form of convenience sampling.
Convenience Sample: Results apply only to observed subjects.
Volunteer Sample: Volunteers may not represent the population.

Types of Bias in Sample Surveys
Bias is a systematic tendency to favor certain parts of the population.
Sampling Bias: Due to nonrandom samples or undercoverage.
Nonresponse Bias: When subjects cannot be reached or refuse to participate.
Response Bias: When subjects give incorrect responses or questions are misleading.
Key Parts of a Sample Survey
Identify the population of interest.
Construct a sampling frame.
Use random sampling to select subjects.
Be cautious of sampling bias.
Section 4.3: Experimental Design
Elements of an Experiment
Experiments involve deliberate assignment of treatments to subjects to observe their responses.
Experimental Units: Subjects measured in the experiment.
Treatment: Experimental condition imposed on subjects.
Explanatory Variable: Defines groups to be compared.
Response Variable: Outcome measured to assess treatment effect.
Components of a Good Experiment
Control/Comparison Group: Allows analysis of treatment effectiveness.
Randomization: Eliminates researcher bias and balances groups.
Replication: Assigns several units to each treatment, increasing confidence in results.
Example: TV Advertising Experiment
College students viewed ads of varying length and frequency. Their recall, attitude, and purchase intention were measured.
Subjects: College students
Factors: Length and repetition of ads
Treatments: Combinations of ad length and repetition
Response Variables: Recall, attitude, purchase intention
Principle 1: Control or Comparison Group
Placebo: Dummy treatment used in control groups.
Control Group: Receives placebo or standard treatment for comparison.
Principle 2: Randomization
Random assignment eliminates bias and balances groups on known and unknown variables.
Principle 3: Replication
Assigning multiple units to each treatment reduces ordinary variation and increases confidence in results.
Blinding the Experiment
Blinding: Subjects are unaware of their treatment.
Double-Blinding: Neither subjects nor investigators know the treatment assignments, controlling response bias.
Statistical Significance
If the observed difference is larger than expected by chance, it is statistically significant.
Practical significance should also be considered.
Generalizing Results
Results should be generalized only to the population represented by the study.
Lesson Summary
Two primary methods for gathering data: observational study and experiment.
Observational studies identify associations but not causation.
Randomization minimizes effects of lurking variables.
Biases can arise from undercoverage, nonresponse, and response bias.
Experiments assign subjects to treatments and often use placebos in control groups.
