 Back
Study Guide: Discrete and Binomial Random Variables in Introductory Statistics
Study Guide - Smart Notes
 Tailored notes based on your materials, expanded with key definitions, examples, and context.
Discrete and Continuous Random Variables
Definition and Classification
Random variables are fundamental concepts in statistics, representing numerical outcomes of random phenomena. They are classified as either discrete or continuous based on the nature of their possible values.
Discrete Random Variable: Takes countable values, such as integers or finite sets.
Continuous Random Variable: Takes any value within a given interval, including all rational numbers.
Example: The number of heads in 10 coin flips is discrete; the exact height of a person is continuous.
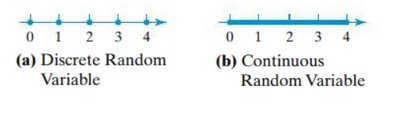
Probability Distributions of Discrete Random Variables
Probability Distribution Table
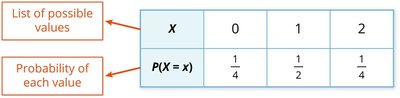
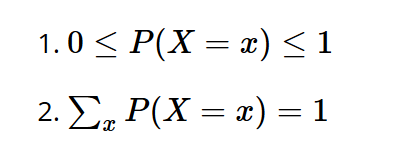
A probability distribution for a discrete random variable lists all possible values and their associated probabilities. The distribution must satisfy two principles:
All probabilities are between 0 and 1.
The sum of all probabilities equals 1.
Example: Probability distribution for X = number of tails in two coin flips:
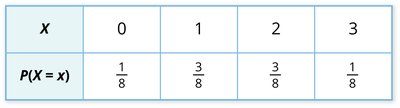
Example: Probability distribution for X = number of tails in three coin flips:
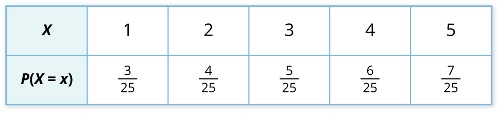
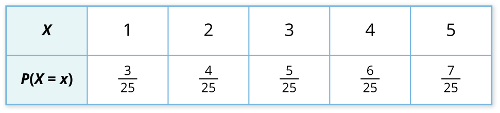
Example: Probability distribution for X with values 1 to 5:
X | 1 | 2 | 3 | 4 | 5 |
|---|---|---|---|---|---|
P(X = x) | \frac{3}{25} | \frac{4}{25} | \frac{5}{25} | \frac{6}{25} | \frac{7}{25} |
Principles of Probability Distributions:
Mean (Expected Value) of a Discrete Random Variable
Definition and Calculation
The mean or expected value of a discrete random variable represents its long-run average value. It is calculated as:
Example: For X with values 1 to 5 and probabilities as above:
Mean =
Standard Deviation of a Discrete Random Variable
Definition and Calculation
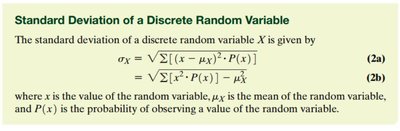
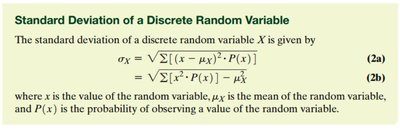
The standard deviation measures the spread or dispersion of a random variable's values. For a discrete random variable X:
Alternatively,
Where is a value of the random variable, is the mean, and is the probability of $x$.
Example: For X with mean 3.4 and probabilities as above:
Standard deviation =
Binomial Random Variables
Definition and Requirements
A binomial random variable is a special case of a discrete random variable, representing the number of successes in a fixed number of independent trials, each with the same probability of success.
Fixed number of trials ()
Each trial is independent
Each trial has two possible outcomes: "success" or "failure"
Constant probability of success () for each trial
Example: Tossing a coin times and counting the number of heads.
Probability Distribution of a Binomial Random Variable
The probability of observing successes in trials is given by:
Example: For , :
X | 0 | 1 | 2 | 3 | 4 |
|---|---|---|---|---|---|
P(X = x) | 0.2401 | 0.4116 | 0.2646 | 0.0756 | 0.0081 |
Mean and Standard Deviation of a Binomial Random Variable
Formulas and Interpretation
For a binomial random variable with trials and probability of success:
Mean (expected value):
Standard deviation:
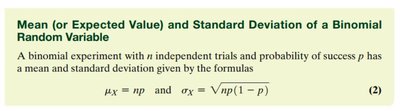
Example: If 30% of female statistics students have tattoos and a random sample of 4 students is taken (, ):
Mean:
Standard deviation:
Practice Problems and Applications
Identifying Binomial Random Variables
To determine if a random variable is binomial, check if it meets all requirements: fixed number of trials, independence, two outcomes, and constant probability of success.
Example 1: Flipping a fair coin 50 times and counting tails (, ) — binomial.
Example 2: Rolling a die 100 times and counting threes (, ) — binomial.
Example 3: Rolling a die until a three appears — not binomial (number of trials not fixed).
Example 4: Answering 20 quiz questions with varying probabilities — not binomial (probability not constant).
Summary Table: Binomial Random Variable Requirements
Requirement | Description |
|---|---|
Fixed number of trials | n is specified |
Independence | Each trial does not affect others |
Two outcomes | "Success" or "Failure" |
Constant probability | p is the same for each trial |
Additional info: Technology (such as RStudio or Excel) is often used to compute probabilities and standard deviations for discrete and binomial random variables, especially for large n.
