 Back
BackStudy Guide for Normal Distribution and Sampling in Statistics
Study Guide - Smart Notes
 Tailored notes based on your materials, expanded with key definitions, examples, and context.
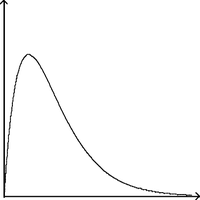
Q1. Determine whether the graph can represent a normal curve. If it cannot, explain why.
Background
Topic: Properties of the Normal Curve
This question tests your understanding of what makes a curve 'normal' in statistics, specifically the characteristics of the normal distribution.
Key Terms:
Normal Distribution: A symmetric, bell-shaped curve representing the distribution of a continuous random variable.
Skewness: A measure of asymmetry in a distribution.
Mean, Median, Mode: For a normal curve, these are all equal and located at the center.
Step-by-Step Guidance
Examine the shape of the curve. Is it symmetric about the center?
Check if the curve has a single peak (unimodal) and tails that extend infinitely in both directions.
Compare the curve to the properties of a normal distribution: symmetry, bell shape, and equal mean/median/mode.
Identify any deviations, such as skewness or multiple peaks, that would disqualify it as a normal curve.
Try solving on your own before revealing the answer!
Final Answer:
This graph cannot represent a normal curve because it is not symmetric and is skewed to the right. A normal curve must be symmetric and bell-shaped.
The mean, median, and mode are not aligned, and the tails do not extend equally in both directions.
Q2. The weight of 2-year old hyraxes is known to be normally distributed with mean μ = 2200 grams and standard deviation σ = 365 grams.
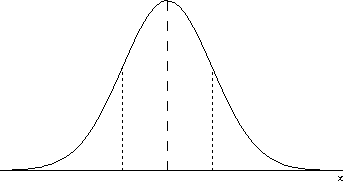
a) Draw a normal curve with the parameters labeled.
b) Shade the region that represents the proportion of hyraxes who weighed more than 2930 grams.
c) Suppose the area under the normal curve to the right of X = 2930 is 0.0228. Provide two interpretations of this result.
Background
Topic: Area under the Normal Curve
This question tests your ability to visualize and interpret the normal distribution, including labeling parameters and understanding the meaning of area under the curve.
Key Terms and Formulas:
Mean (): The center of the distribution.
Standard Deviation (): Measures spread.
Normal Curve: Bell-shaped, symmetric about the mean.
Area under the curve: Represents probability or proportion.
Step-by-Step Guidance
Draw a horizontal axis and mark the mean ( grams) at the center.
Label points at , , , , , etc.
For part b, identify the value grams and shade the region to the right of this value under the curve.
For part c, interpret the area (0.0228) as the proportion of hyraxes weighing more than 2930 grams, and as the probability that a randomly selected hyrax weighs more than 2930 grams.
Try solving on your own before revealing the answer!
Final Answer:
a) The normal curve is centered at 2200 grams, with standard deviation intervals labeled.
b) The shaded region to the right of 2930 grams represents hyraxes weighing more than 2930 grams.
c) 0.0228 means that 2.28% of hyraxes weigh more than 2930 grams, and the probability of randomly selecting such a hyrax is 0.0228.
