 Back
Study Guide: Measures of Dispersion, Empirical Rule, and Weighted Mean in Introductory Statistics
Study Guide - Smart Notes
 Tailored notes based on your materials, expanded with key definitions, examples, and context.
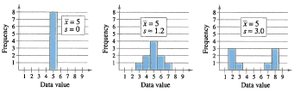
Q1. Compare the histograms below: Are the means the same? What makes these histograms different?
Background
Topic: Measures of Central Tendency and Dispersion
This question tests your understanding of how data sets can have the same mean but different spreads (dispersion). It also introduces the concept of standard deviation as a measure of spread.
Key Terms and Formulas:
Mean (): The average value of a data set.
Standard Deviation (): A measure of how spread out the numbers in a data set are.
Dispersion: The degree to which data values are spread out around the mean.
Step-by-Step Guidance
Observe the mean values given in each histogram. Are they the same or different?
Look at the spread of the data in each histogram. Is the data tightly clustered or more spread out?
Consider how the standard deviation (noted as in the images) changes as the spread increases.
Think about what it means for two data sets to have the same mean but different standard deviations.
Try solving on your own before revealing the answer!
Final Answer:
All three histograms have the same mean (), but their standard deviations are different: , , and . The difference is in the spread of the data—histogram 1 has all values at the mean (no spread), histogram 2 has moderate spread, and histogram 3 has the greatest spread. This demonstrates that data sets can have the same mean but very different variability.
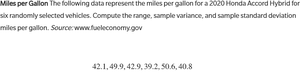
Q2. The following data represent the miles per gallon for a 2020 Honda Accord Hybrid for six randomly selected vehicles. Compute the range, sample variance, and sample standard deviation.
Background
Topic: Measures of Dispersion (Range, Variance, Standard Deviation)
This question asks you to calculate three common measures of dispersion for a small data set: range, sample variance, and sample standard deviation.
Key Terms and Formulas:
Range:
Sample Variance ():
Sample Standard Deviation ():
Step-by-Step Guidance
Identify the maximum and minimum values in the data set to compute the range.
Calculate the mean () of the data set.
Subtract the mean from each data value, square the result, and sum these squared differences.
Divide the sum of squared differences by (where is the number of data points) to find the sample variance.
Take the square root of the sample variance to find the sample standard deviation.
Try solving on your own before revealing the answer!
Final Answer:
Range: Sample mean: Sample variance: Sample standard deviation: These calculations show the spread of miles per gallon among the six vehicles.
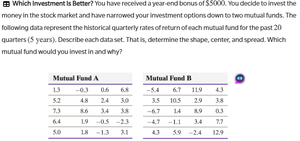
Q3. Which Investment is Better? Describe each data set (shape, center, spread) for Mutual Fund A and Mutual Fund B. Which mutual fund would you invest in and why?
Background
Topic: Descriptive Statistics (Shape, Center, Spread)
This question asks you to analyze two data sets by describing their shape (distribution), center (mean/median), and spread (range/standard deviation), and to make a decision based on your analysis.
Key Terms and Formulas:
Shape: Refers to the distribution (e.g., symmetric, skewed).
Center: Typically the mean or median.
Spread: Range, variance, or standard deviation.
Step-by-Step Guidance
Calculate the mean and median for each mutual fund to determine the center.
Compute the range and standard deviation for each fund to assess the spread.
Examine the data for symmetry or skewness to describe the shape.
Compare the two funds based on these statistics and consider which is more attractive for investment (higher mean, lower risk).
Try solving on your own before revealing the answer!
Final Answer:
Mutual Fund A has a higher mean and lower standard deviation compared to Mutual Fund B, indicating higher average returns and less risk. The shape of Fund A is more symmetric, while Fund B is more variable and possibly skewed. Based on these statistics, Mutual Fund A is generally the better investment due to its higher average return and lower risk.
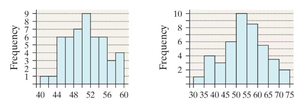
Q4. Which histogram depicts greater standard deviation? Why?
Background
Topic: Standard Deviation and Data Spread
This question tests your ability to visually compare the spread of two distributions and relate it to the concept of standard deviation.
Key Terms and Formulas:
Standard Deviation (): A measure of how much the data values deviate from the mean.
Step-by-Step Guidance
Look at the width of the data in each histogram. Which one has data values that are more spread out from the center?
Recall that a larger spread means a larger standard deviation.
Compare the range and clustering of the bars in each histogram.
Try solving on your own before revealing the answer!
Final Answer:
The histogram on the right depicts a greater standard deviation because its data values are more spread out from the center, covering a wider range of values. The left histogram is more tightly clustered, indicating a smaller standard deviation.
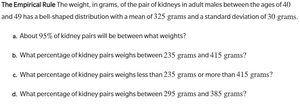
Q5. The Empirical Rule: The weight, in grams, of the pair of kidneys in adult males between the ages of 40 and 49 has a bell-shaped distribution with a mean of 325 grams and a standard deviation of 30 grams.
Background
Topic: Empirical Rule (68-95-99.7 Rule)
This question asks you to apply the Empirical Rule to a normal distribution to estimate percentages and intervals.
Key Terms and Formulas:
Empirical Rule: For a normal distribution:
About 68% of data within 1 standard deviation of the mean
About 95% within 2 standard deviations
About 99.7% within 3 standard deviations
Interval Calculation:
Step-by-Step Guidance
For part (a), calculate the interval that is within 2 standard deviations of the mean.
For part (b), use the Empirical Rule to determine the percentage of data within 2 standard deviations.
For part (c), find the percentage outside 2 standard deviations (less than mean - 2SD or more than mean + 2SD).
For part (d), calculate the interval for 1 standard deviation above and below the mean and use the Empirical Rule to estimate the percentage.
Try solving on your own before revealing the answer!
Final Answer:
(a) About 95% of kidney pairs will be between 265 grams and 385 grams ().
(b) 95% of kidney pairs weigh between 265 grams and 385 grams.
(c) About 5% of kidney pairs weigh less than 265 grams or more than 385 grams (outside 2 SDs).
(d) Between 295 grams and 355 grams is within 1 SD, so about 68% of kidney pairs fall in this range.
Q6. Computing Class Average: In Marissa's calculus course, attendance counts for 5% of the grade, quizzes count for 10%, exams count for 60%, and the final exam counts for 25%. Marissa had a 100% average for attendance, 95% for quizzes, 86% for exams, and 85% on the final. Determine Marissa's course average.

Background
Topic: Weighted Mean
This question asks you to calculate a weighted mean, where each component of the grade has a different weight.
Key Terms and Formulas:
Weighted Mean:
= weight of each component, = score for each component
Step-by-Step Guidance
List each component's score and its corresponding weight (as a decimal).
Multiply each score by its weight.
Add up all the weighted scores.
The sum is Marissa's course average.
Try solving on your own before revealing the answer!
Final Answer:
Marissa's course average is: So, her course average is 87.35%.
