 Back
BackStudy Notes: Normal Probability Distributions
Study Guide - Smart Notes
 Tailored notes based on your materials, expanded with key definitions, examples, and context.
Normal Probability Distributions
Uniform Distribution
The uniform distribution is a type of continuous probability distribution where all outcomes are equally likely within a specified range. The graph of a uniform distribution is rectangular, reflecting the equal probability for all values in the interval.
Definition: A continuous random variable has a uniform distribution if its values are evenly spread across the range of possible values.
Area under the curve: The total area under the graph of a continuous probability distribution is always 1, representing the total probability.
Probability calculation: Probabilities are found by calculating the area under the curve for the relevant interval. For a uniform distribution, this is the area of a rectangle.
Formula for probability: If the interval is from a to b, and the probability of an event between x1 and x2 is needed:
Example: If waiting times are uniformly distributed between 0 and 5 minutes, the probability that a randomly selected passenger waits at least 2 minutes is the area from 2 to 5 divided by the total area (0 to 5).
Normal Distributions
Characteristics of Normal Distributions
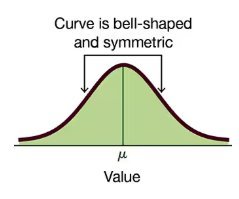
A normal distribution is a continuous probability distribution characterized by its bell-shaped and symmetric curve. There are infinitely many normal distributions, each defined by its mean (μ) and standard deviation (σ).
Definition: A random variable is normally distributed if its probability density function can be described by the normal distribution equation.
Shape: The curve is bell-shaped and symmetric about the mean.
Parameters: The mean (μ) determines the center, and the standard deviation (σ) determines the spread.
Equation: The probability density function for a normal distribution is:
Example: Heights, test scores, and measurement errors often follow a normal distribution.
The Standard Normal Distribution
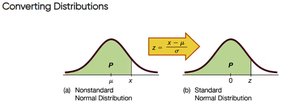
The standard normal distribution is a special case of the normal distribution with a mean of 0 and a standard deviation of 1. Its curve is also bell-shaped and symmetric, and the total area under the curve is 1.
Parameters: Mean (μ) = 0, Standard deviation (σ) = 1.
Notation: The variable z is used to represent values in the standard normal distribution.
Conversion: Any normal distribution can be converted to the standard normal distribution using the z-score formula:
Application: Standardizing allows comparison across different normal distributions and use of standard normal tables.
Additional info: The process of converting distributions is fundamental for hypothesis testing and confidence interval estimation in statistics.
