 Back
BackSummarising Data: Numerical Methods in Statistics
Study Guide - Smart Notes
 Tailored notes based on your materials, expanded with key definitions, examples, and context.
Summarising Data: Numerical Methods
3.1 Sigma and Factorial Notation
Understanding sigma and factorial notation is fundamental for performing calculations in statistics, especially when dealing with large data sets or combinatorial problems.
3.1.1 Sigma Notation
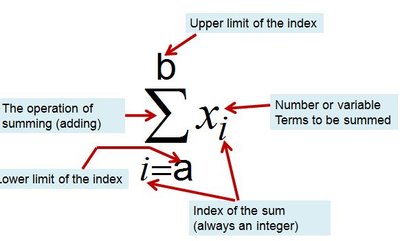
Sigma notation (∑) is a concise way to represent the sum of a sequence of terms.
The general form is , where a is the lower limit, b is the upper limit, and x_i are the terms to be summed.
Key rules:
, for
Example:
3.1.2 Factorial Notation
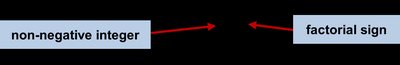
Factorial notation (n!) represents the product of all positive integers up to n.
Key rules:
Example:
3.2 Measures of Location
Measures of location describe the central tendency or typical value of a data set. The most common measures are the mean, median, and mode.
3.2.1 Mean
The mean (average) is the sum of all data values divided by the number of values.
Sample mean:
Population mean:
Example: For data 46, 54, 42, 46, 32:
3.2.2 Median
The median is the middle value when data are ordered from smallest to largest.
If n is odd, the median is the middle value; if n is even, it is the average of the two middle values.
Example (odd n): Data: 32, 42, 46, 46, 54. Median = 46.
Example (even n): Data: 32, 33, 39, 42, 46, 46, 47, 51, 54. Median = (46+46)/2 = 46.
3.2.3 Mode
The mode is the value that appears most frequently in the data set.
Data can be unimodal (one mode), bimodal (two modes), or multimodal (more than two modes).
Example: Data: 46, 54, 42, 46, 32. Mode = 46.
For categorical data, only the mode is meaningful.
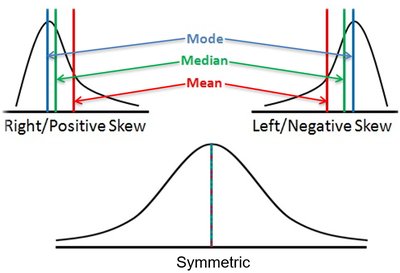
Identifying the Shape of Data Using Mean, Median, and Mode
If mean > median > mode: Positively skewed (right-skewed)
If mean < median < mode: Negatively skewed (left-skewed)
If mean = median = mode: Symmetric distribution
3.2.4 Percentiles
A percentile indicates the value below which a given percentage of observations fall.
To find the pth percentile:
Order the data from smallest to largest.
Compute the index:
If i is not an integer, interpolate between the closest ranks.
Example: For 12 salaries, the 80th percentile is found at index 10.4, so interpolate between the 10th and 11th values.
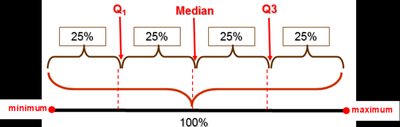
3.2.5 Quartiles
Quartiles divide the data into four equal parts:
Q1: 25th percentile
Q2: 50th percentile (median)
Q3: 75th percentile
Quartiles are special cases of percentiles and are calculated using the same method.
3.3 Measures of Variability
Measures of variability describe the spread or dispersion of a data set. The simplest measure is the range.
3.3.1 Range
The range is the difference between the largest and smallest values in the data set.
Formula:
Advantages: Easy to calculate.
Disadvantages: Only considers two values; highly sensitive to outliers.
Example: For salaries 3310 to 3925, range = 3925 - 3310 = 615. If one value is 10000, range = 10000 - 3310 = 6690.
