 Back
BackTesting Hypotheses About Proportions
Study Guide - Smart Notes
 Tailored notes based on your materials, expanded with key definitions, examples, and context.
Testing Hypotheses About Proportions
Introduction to Hypothesis Testing
Hypothesis testing is a fundamental statistical method used to make inferences about population parameters based on sample data. In the context of proportions, it allows us to determine whether an observed sample proportion provides enough evidence to conclude that the population proportion has changed from a hypothesized value.
Confidence Intervals estimate the range of plausible values for a population parameter.
Hypothesis Tests assess whether sample data provide sufficient evidence to reject a specific claim about a population parameter.
Statistical Hypotheses
Null Hypothesis (H0): A statement about a population parameter that indicates no effect or no difference. It is the hypothesis to be tested, often representing the status quo.
Alternative Hypothesis (Ha): A statement that contradicts the null hypothesis, indicating a change, effect, or difference.
Example: Testing if a new process reduces the defect rate of metal ingots from 20% (H0: p = 0.20) to a lower value (Ha: p < 0.20).
The Logic of Hypothesis Testing
The process of hypothesis testing is analogous to a jury trial:
Assume innocence (null hypothesis) until evidence suggests otherwise.
Reject the null hypothesis only if the evidence is strong enough (i.e., the observed data would be very unlikely if H0 were true).
Failing to reject H0 does not prove it true; it only means there is insufficient evidence against it.
P-Values
P-value: The probability, assuming the null hypothesis is true, of obtaining a result as extreme or more extreme than the observed sample statistic.
A small P-value indicates strong evidence against H0; a large P-value suggests insufficient evidence to reject H0.
Reporting the P-value allows others to judge the strength of the evidence.
The Four Steps of Hypothesis Testing
State the Hypotheses: Formulate H0 and Ha in terms of population parameters.
Choose the Model: Select the appropriate statistical model (e.g., Normal model for large samples) and check assumptions (randomization, independence, and success/failure conditions).
Mechanics: Calculate the test statistic and corresponding P-value using the sample data.
Conclusion: Decide whether to reject or fail to reject H0, and interpret the result in context.
One-Proportion Z-Test
The one-proportion z-test is used to test hypotheses about a population proportion. The test statistic is calculated as follows:
Let p̂ be the sample proportion, p0 the hypothesized population proportion, and n the sample size.
If the assumptions are met, the test statistic follows a standard Normal distribution under H0.
Types of Alternative Hypotheses
One-sided test: Ha: p > p0 or Ha: p < p0 (interest in deviation in one direction).
Two-sided test: Ha: p ≠ p0 (interest in deviation in either direction).
Example: Ingots Defect Rate
Suppose a plant historically has a 20% defect rate for metal ingots. After process improvements, 400 ingots are produced, and 17% are found to be defective. We want to test if the defect rate has decreased.
H0: p = 0.20
Ha: p < 0.20
Sample size: n = 400, observed p̂ = 0.17
Test statistic calculation:
The P-value is the probability of observing a sample proportion of 0.17 or less, given H0 is true. For z = -1.50, P-value ≈ 0.067.
Conclusion: At a 95% confidence level (α = 0.05), the P-value (0.067) is not small enough to reject H0. There is not enough evidence to conclude the defect rate has decreased significantly.
Example: DMV Teen Pass Rate
Claim: 80% of all drivers pass the test. In a sample of 90 teens, 61 passed (p̂ ≈ 0.678).
H0: p = 0.80
Ha: p < 0.80
Test statistic:
P-value ≈ 0.002
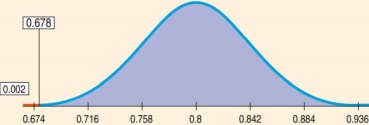
Conclusion: The P-value is very small, so we reject H0. There is strong evidence that the teen pass rate is less than 80%.
Choosing a Significance Level (α)
The threshold for rejecting H0 (α) depends on the context and consequences of the decision.
For critical decisions (e.g., safety), a smaller α (e.g., 0.01) is used. For less critical decisions, a larger α (e.g., 0.05) may suffice.
Assumptions and Conditions for the One-Proportion Z-Test
Randomization/Independence: The sample should be randomly selected and observations independent.
10% Condition: The sample size should be less than 10% of the population.
Success/Failure Condition: Both np0 and nq0 should be at least 10.
Common Mistakes in Hypothesis Testing
Do not base hypotheses on the observed data; hypotheses should be about the population.
Do not "accept" the null hypothesis; you can only fail to reject it.
Always check the necessary conditions before performing the test.
Summary Table: One-Proportion Z-Test
Test Type | Alternative Hypothesis | Reject H0 if |
|---|---|---|
Lower-tailed | Ha: p < p0 | P-value < α |
Upper-tailed | Ha: p > p0 | P-value < α |
Two-tailed | Ha: p ≠ p0 | P-value < α |
What Have We Learned?
How to formulate null and alternative hypotheses for proportions.
How to check assumptions and conditions for the one-proportion z-test.
How to calculate and interpret the test statistic and P-value.
The importance of context in choosing significance levels and interpreting results.
The relationship between hypothesis tests and confidence intervals.
Additional info: Confidence intervals provide a range of plausible values for the parameter, while hypothesis tests assess the plausibility of a specific value. Both tools are essential for statistical inference.
