 Back
The Standard Normal Distribution: Calculating Areas and Percentiles
Study Guide - Smart Notes
 Tailored notes based on your materials, expanded with key definitions, examples, and context.
The Standard Normal Distribution
Understanding the Standard Normal Distribution
The standard normal distribution is a special case of the normal distribution with a mean of 0 and a standard deviation of 1. It is used extensively in statistics to calculate probabilities and percentiles for normally distributed data.
Z-score: Represents the number of standard deviations a value is from the mean.
Area under the curve: Corresponds to the probability or proportion of values within a specified range.
Calculating Areas Under the Standard Normal Curve
Areas under the standard normal curve can be found using statistical calculators or tables. The calculator function normalcdf is commonly used to compute probabilities for intervals.
normalcdf(lower, upper, mean, std. deviation): Calculates the probability that a z-score falls between the lower and upper bounds.
Examples of Area Calculations
Between z = 0 and z = 1.47:
Between z = -0.56 and z = 0:
To the right of z = 1.93:
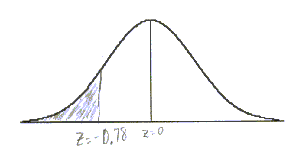
To the left of z = -0.78:
Percentages and Percentiles in the Standard Normal Distribution
Percentages and percentiles are used to describe the proportion of values above, below, or between certain z-scores. The invNorm function finds the z-score corresponding to a given percentile.
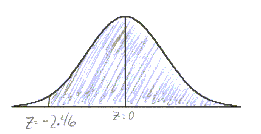
Percentage above z = -2.46:
Percentage between z = 1.24 and z = 2.09:
Finding Percentiles and Cutoff Scores
40th percentile (P40):
Lowest z-score in the top 2.5%:
Z-scores cutting off the lowest 15% and highest 20%:
Lowest 15%:
Highest 20%:
Summary Table: Standard Normal Distribution Calculations
Calculation | Formula | Result |
|---|---|---|
Area between z = 0 and z = 1.47 | 0.4292 | |
Area between z = -0.56 and z = 0 | 0.2123 | |
Area to the right of z = 1.93 | 0.0268 | |
Area to the left of z = -0.78 | 0.2177 | |
Percentage above z = -2.46 | 99.31% | |
Percentage between z = 1.24 and z = 2.09 | 8.92% | |
40th percentile (P40) | -0.25 | |
Lowest z-score in top 2.5% | 1.96 | |
Lowest 15% cutoff | -1.04 | |
Highest 20% cutoff | 0.84 |
