 Back
BackUsing an Ogive to Estimate Sample Size
Study Guide - Smart Notes
 Tailored notes based on your materials, expanded with key definitions, examples, and context.
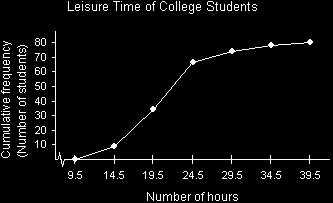
Q4. Use the ogive below to approximate the number in the sample.
Background
Topic: Ogives and Cumulative Frequency
This question tests your ability to interpret an ogive (a cumulative frequency graph) to estimate the total number of observations (sample size) in a data set.
Key Terms and Concepts:
Ogive: A graph that represents the cumulative frequency for a data set. Each point shows the total number of observations less than or equal to the upper boundary of a class interval.
Cumulative Frequency: The sum of the frequencies for all classes up to and including the current class.
Step-by-Step Guidance
Examine the ogive and identify the highest cumulative frequency value on the vertical axis. This value represents the total number of data points in the sample.
Locate the rightmost plotted point on the ogive. The y-value (cumulative frequency) at this point is the sample size.
Double-check that you are reading the cumulative frequency axis correctly, and that you are using the last (highest) cumulative frequency value.
Try solving on your own before revealing the answer!
Final Answer: 80
The highest cumulative frequency on the ogive is 80, so the sample size is 80 students.
This is found by reading the y-value of the last point on the graph.
