 Back
BackUsing an Ogive to Estimate Sample Size
Study Guide - Smart Notes
 Tailored notes based on your materials, expanded with key definitions, examples, and context.
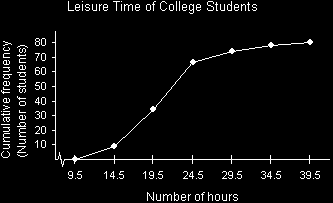
Q4. Use the ogive below to approximate the number in the sample.
Background
Topic: Ogives and Cumulative Frequency
This question tests your ability to interpret an ogive (a cumulative frequency graph) to estimate the total sample size represented in the data.
Key Terms and Concepts:
Ogive: A graph that represents the cumulative frequency for a dataset. Each point shows the total number of observations less than or equal to the upper boundary of a class interval.
Cumulative Frequency: The running total of frequencies through the classes in a frequency distribution.
Step-by-Step Guidance
Examine the ogive and identify the highest cumulative frequency value on the vertical axis. This value represents the total number of observations (sample size).
Locate the rightmost plotted point on the ogive. The y-value of this point is the cumulative frequency for the last class interval, which should equal the total sample size.
Read the y-axis value at this rightmost point carefully. Make sure to match it with the corresponding cumulative frequency value.
Try solving on your own before revealing the answer!
Final Answer: 80
The rightmost point on the ogive corresponds to a cumulative frequency of 80, which means the sample size is 80 students.
This is because the cumulative frequency at the last class interval always equals the total number of observations in the sample.
