 Back
BackUsing the Mean and Standard Deviation to Describe Data: Chebyshev’s Rule and the Empirical Rule
Study Guide - Smart Notes
 Tailored notes based on your materials, expanded with key definitions, examples, and context.
Using the Mean and Standard Deviation to Describe Data
Introduction
The mean and standard deviation are fundamental statistics used to describe the center and spread of a data set. While the mean provides a measure of central tendency, the standard deviation quantifies the variability or dispersion of the data. Two important rules—Chebyshev’s Rule and the Empirical Rule—help us interpret how data values are distributed around the mean, especially in terms of how many measurements fall within one, two, or three standard deviations.
Chebyshev’s Rule
Definition and Application
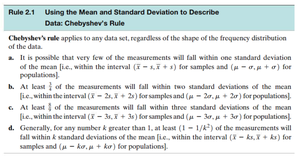
Chebyshev’s Rule applies to any data set, regardless of the shape of its frequency distribution. It provides minimum proportions of data that must fall within a certain number of standard deviations from the mean.
Key Point 1: For any data set, very few measurements may fall within one standard deviation of the mean.
Key Point 2: At least 75% of measurements will fall within two standard deviations of the mean.
Key Point 3: At least 89% of measurements will fall within three standard deviations of the mean.
Key Point 4: For any number k > 1, at least of the measurements will fall within k standard deviations of the mean.
Formula:
For samples:
For populations:
The Empirical Rule
Definition and Application
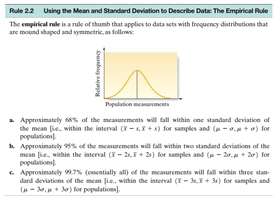
The Empirical Rule applies to data sets with mound-shaped, symmetric distributions (approximately normal distributions). It provides more precise percentages for data within one, two, and three standard deviations of the mean.
Key Point 1: Approximately 68% of measurements fall within one standard deviation of the mean.
Key Point 2: Approximately 95% fall within two standard deviations.
Key Point 3: Approximately 99.7% fall within three standard deviations.
Formula:
For samples:
For populations:
Examples and Applications
Example 1: Rat Maze Times
Thirty students timed rats running through a maze. The times (in minutes) are listed in Table 2.7. The task is to determine the fraction of measurements within , , and , and compare with Chebyshev’s and Empirical Rule predictions.
Times (Minutes) |
|---|
1.97, 2.20, 3.30, 1.15, 6.06, 6.54, 2.00, 3.37, 3.65 |
1.74, 2.25, 3.48, 2.30, 1.16, 4.56, 4.23, 1.45, 7.06, 1.66 |
3.77, 5.36, 1.06, 1.71, 2.47, 4.25, 1.93, 5.15, 2.06, 1.65 |
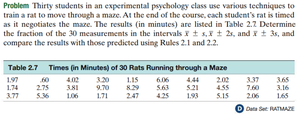
Application: Calculate the mean and standard deviation, then count the number of times within each interval. Compare these fractions to the minimums given by Chebyshev’s Rule and the percentages from the Empirical Rule.
Example 2: Gas Mileage Data
Chebyshev’s and Empirical Rules can be used to check the reasonableness of a calculated standard deviation. For example, if the standard deviation for gas mileage data (Table 2.2) is calculated to be 5.85, we can use the rules to judge if this value is plausible.
EPA Mileage Ratings (100 Cars) |
|---|
36.3, 41.0, 36.9, 37.1, 44.9 |
40.5, 37.3, 41.2, 36.6, 32.9 |
... (additional values omitted for brevity) |
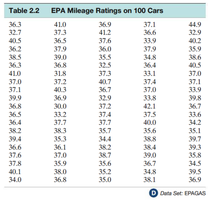
Application: Use the calculated mean and standard deviation to determine the proportion of data within one, two, and three standard deviations, and compare to the rules.
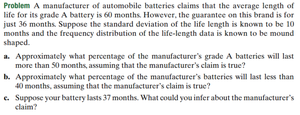
Example 3: Battery Life Problem
A manufacturer claims the average battery life is 60 months with a standard deviation of 10 months, and the distribution is mound-shaped. The Empirical Rule can be used to estimate the percentage of batteries lasting more than 50 months, less than 40 months, and to interpret individual battery lifespans.
Key Point 1: Calculate the z-score for 50 and 40 months to determine their position relative to the mean.
Key Point 2: Use the Empirical Rule to estimate the percentage of batteries above or below these values.
Key Point 3: Interpret the result for a battery lasting 37 months.
Example: For 50 months: . About 84% of batteries last more than 50 months (since 68% are within one standard deviation, half above and half below).
Summary Table: Chebyshev’s Rule vs. Empirical Rule
Rule | 1 SD | 2 SD | 3 SD |
|---|---|---|---|
Chebyshev | Varies | ≥ 75% | ≥ 89% |
Empirical | 68% | 95% | 99.7% |
Additional info: The Empirical Rule is most accurate for normal distributions, while Chebyshev’s Rule applies to all distributions, making it a conservative estimate.
