 Back
Visualizing and Describing Categorical Data in Introductory Statistics
Study Guide - Smart Notes
 Tailored notes based on your materials, expanded with key definitions, examples, and context.
Section 2.3: Visualizing Variation in Categorical Variables
Bar Charts
Bar charts (also called bar graphs or bar plots) are a primary tool for visualizing categorical data. Each bar represents a category, and the height of the bar is proportional to the frequency or relative frequency of that category. The vertical axis can display either frequency (count) or relative frequency (proportion), but the overall shape of the chart remains unchanged.
Definition: A bar chart displays the distribution of a categorical variable by showing bars for each category, with heights corresponding to their frequencies or relative frequencies.
Relative Frequency: Calculated as the frequency of a category divided by the total number of observations.
Example: The bar chart below shows the relative frequency distribution of class standing for students interested in a UCLA statistics course.
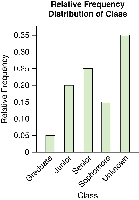
Pareto Chart: A special type of bar chart where bars are arranged from tallest to shortest. This is useful for highlighting the most common categories. Note: This ordering is not appropriate for histograms, which are used for numerical data.
Bar Chart vs. Histogram
While both bar charts and histograms use bars to display data, they serve different purposes and have key differences:
Bar Chart: Used for categorical variables. Bars are separated, and the order of categories is arbitrary unless a Pareto chart is used.
Histogram: Used for numerical variables. Bars touch each other, and the order of intervals (bins) is meaningful and fixed.
Additional info: Histograms display the distribution of continuous or discrete numerical data, while bar charts are for categorical data.
Pie Charts
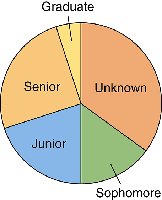
A pie chart is a circular graph divided into slices, where each slice represents a category. The area of each slice is proportional to the relative frequency of that category. Pie charts are useful for showing the composition of a whole.
Definition: A pie chart visually represents the proportion of each category in a categorical variable as slices of a circle.
Example: The pie chart below shows the class standing of students interested in a UCLA statistics course.
Section 2.4: Describing a Categorical Distribution
Describing a categorical distribution involves summarizing the main features of the data. Unlike numerical distributions, categorical data may not have a natural order, so we focus on different aspects.
Main Components of a Categorical Distribution
Mode: The category with the highest frequency (the most common category). For categorical data, the mode is often the most informative measure of center.
Variability: Describes how spread out the data are across categories. High variability means responses are spread across many categories; low variability means most responses are concentrated in one or a few categories.
Examples of Describing Categorical Distributions
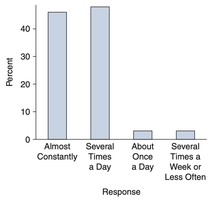
Mode Example: In a survey of U.S. teens about internet usage, the most common responses (modes) were "Almost Constantly" and "Several Times a Day."
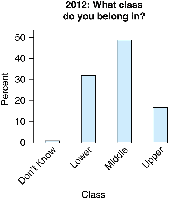
Another Mode Example: In a 2012 Pew survey, the most common economic class identified was "Middle."
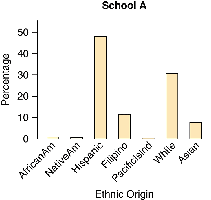
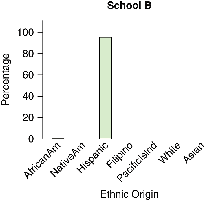
Variability Example: The bar charts below show the ethnic composition of two schools. School A has high variability (several ethnic groups represented), while School B has low variability (almost all students are Hispanic).
Summary Table: Categorical Data Visualization Methods
Graph Type | Best For | Key Features |
|---|---|---|
Bar Chart | Categorical variables | Bars separated, order arbitrary, shows frequency or relative frequency |
Pareto Chart | Categorical variables (highlighting most common) | Bars ordered from tallest to shortest |
Pie Chart | Categorical variables (showing parts of a whole) | Slices proportional to relative frequency |
Histogram | Numerical variables | Bars touch, order fixed, shows distribution of data |
Key Formulas
Relative Frequency:
Additional info: When describing categorical data, always mention the most common category (mode) and discuss the variability to provide a complete summary.
