 Back
Visualizing Variation in Numerical Data: Distributions, Dot Plots, Histograms, and Density Plots
Study Guide - Smart Notes
 Tailored notes based on your materials, expanded with key definitions, examples, and context.
Describing Data with Tables and Graphs
Understanding Distribution
The distribution of a dataset describes how the values are spread or arranged. It records the observed values and their frequencies, helping us understand the variation within the data. The distribution is a foundational concept for organizing and interpreting numerical data in statistics.
Frequency: The count of how many times a value occurs in the dataset.
Variation: The differences or spread among data values.
Distributions can be visualized and summarized using various graphical and tabular methods, each with its own strengths and limitations.
Frequency Tables
A frequency table lists each unique value in a dataset alongside the number of times it occurs. This is a simple way to organize raw data and is often the first step in data analysis.
Value | Frequency |
|---|---|
0 | 13 |
1 | 5 |
2 | 2 |
3 | 2 |
4 | 1 |
16 | 1 |
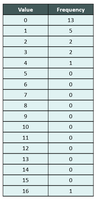
Example: The table above shows the number of goals scored by players on the San Diego Wave Football Club in the 2022 season.
Visualizing Distributions: Dot Plots
Dot plots are simple graphs that display each data point as a dot above its value on a number line. They are especially useful for small to moderate-sized datasets and allow us to see clusters, gaps, and outliers directly.
Each dot represents one observation.
Easy to construct and interpret for small datasets.
Can reveal the shape, center, and spread of the data.
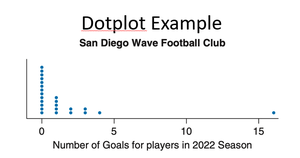
Example: The dot plot above shows the number of goals scored by each player in the 2022 season.
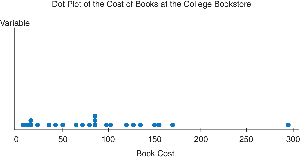
Example: The dot plot above displays the distribution of textbook costs at a college bookstore.
Advantages: Shows all individual data points; easy to spot clusters and outliers.
Disadvantages: Not practical for large datasets; can become cluttered.
Visualizing Distributions: Histograms
Histograms group data into intervals called bins and display the frequency (or relative frequency) of data within each bin as bars. They are ideal for larger datasets and for visualizing the overall shape of the distribution.
Each bar represents the frequency of data within a specific interval.
The choice of bin width affects the appearance and interpretability of the histogram.
Histograms do not show individual data points but provide a summary view.
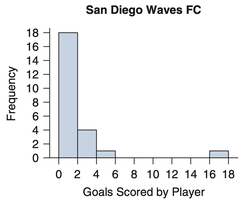
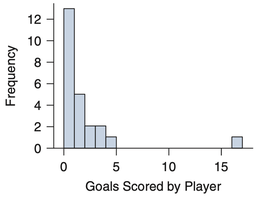
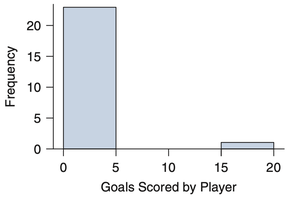
Example: The three histograms above show the same data with different bin widths. Narrow bins reveal more detail, while wider bins provide a smoother summary.
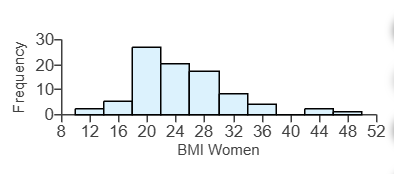
Example: The histogram above displays the distribution of Body Mass Index (BMI) for 86 women.
Advantages: Good for large datasets; shows overall shape and spread; easy to compare groups.
Disadvantages: Choice of bin width can affect interpretation; individual data points are not visible.
Relative Frequency Histograms
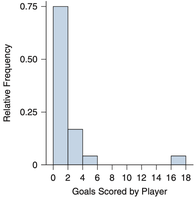
A relative frequency histogram displays the proportion of data within each bin instead of the raw count. This is useful for comparing distributions with different sample sizes.
Vertical axis shows proportion (from 0 to 1) instead of frequency.
Shape of the histogram remains the same; only the scale changes.
Density Plots
Density plots are smooth curves that estimate the probability density function of a continuous variable. They provide a smoothed version of the histogram and are useful for visualizing the underlying shape of the data distribution.
Vertical axis represents density, not frequency or proportion.
Area under the curve sums to 1.
Best for large datasets and for comparing multiple distributions.
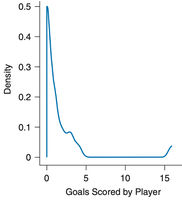
Example: The density plot above shows a smoothed estimate of the distribution of goals scored.
Summary Table: Comparison of Graphical Methods
Method | Best For | Shows Individual Data? | Key Limitation |
|---|---|---|---|
Dot Plot | Small datasets | Yes | Not practical for large datasets |
Histogram | Medium/large datasets | No | Bin width affects interpretation |
Density Plot | Large datasets | No | Requires technology; may obscure small features |
Key Takeaways
Understanding the distribution of data is essential for statistical analysis.
Frequency tables, dot plots, histograms, and density plots are fundamental tools for visualizing and summarizing numerical data.
Choosing the appropriate method depends on the size of the dataset and the information needed.
