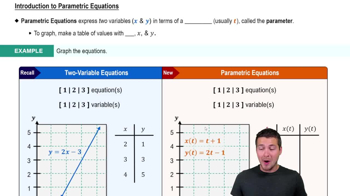
How do you graph the parametric equations x = t^2 + 2t and y = -t?
To graph x = t^2 + 2t and y = -t, create a table of values for t, then compute the corresponding x and y values for each t. Plot the resulting (x, y) points on the coordinate plane and connect them to form the curve. The direction of the curve is indicated by increasing t.
How do you graph the parametric equations x = 1 - t^2 and y = 2t?
To graph x = 1 - t^2 and y = 2t, make a table with selected t values, calculate x and y for each t, and plot the (x, y) points. Connect the points to form the curve, and use arrows to show the direction as t increases.
What is the general process for matching graphs to their parametric equations?
To match graphs to parametric equations, generate a table of (x, y) values by substituting various t values into the equations. Plot these points and observe the resulting shape and direction. Compare the plotted curve to the given graphs to identify the correct match.
Describe how to graph the space curve defined by the parametric equations x = sin(t), y = 3 sin(2t), z = sin(3t).
To graph the space curve x = sin(t), y = 3 sin(2t), z = sin(3t), create a table of t values and compute the corresponding x, y, and z for each t. Plot the (x, y, z) points in three-dimensional space and connect them to visualize the curve, noting the direction as t increases.
What is the role of the parameter t in parametric equations?
The parameter t serves as an independent variable that both x and y are expressed in terms of. It allows you to generate corresponding x and y values for graphing.
How does graphing parametric equations differ from graphing y = 2x - 3?
Graphing parametric equations involves creating a table with t, x, and y columns, while y = 2x - 3 only requires x and y. Parametric equations use t to generate both x and y values.
What is a 'plane curve' in the context of parametric equations?
A plane curve is the graph formed by plotting the (x, y) points generated from parametric equations. It can represent lines, parabolas, or more complex shapes.
Why are t values sometimes written next to their corresponding (x, y) points on a parametric graph?
T values are written to indicate which value of t produced each (x, y) point. This helps clarify the progression and direction of the curve.
How is the direction or orientation of a parametric curve indicated on its graph?
The direction is shown using arrows along the curve, pointing in the direction of increasing t values. This distinguishes the orientation from standard graphs.
Why can't you assume t increases from left to right or bottom to top on a parametric graph?
T does not correspond to a specific axis on the graph, so its increase may not align with standard x or y directions. The progression of t depends on the equations and must be tracked separately.