 Back
BackDistance and Midpoint Formulas; Graphs, Intercepts, and Symmetry in the Coordinate Plane
Study Guide - Smart Notes
 Tailored notes based on your materials, expanded with key definitions, examples, and context.
2.1 The Distance and Midpoint Formulas
The Coordinate Plane
The coordinate plane consists of two perpendicular number lines: the x-axis (horizontal) and the y-axis (vertical). Their intersection point is called the origin, denoted as (0, 0). Any point in the plane is represented by an ordered pair (x, y), where x is the horizontal coordinate and y is the vertical coordinate.
Quadrants: The plane is divided into four quadrants:
Quadrant I: (+, +) — both x and y are positive (e.g., (1, 2))
Quadrant II: (−, +) — x is negative, y is positive (e.g., (−3, 1))
Quadrant III: (−, −) — both x and y are negative (e.g., (−4, −1))
Quadrant IV: (+, −) — x is positive, y is negative (e.g., (3, −2))
Pythagorean Theorem Refresher
The Pythagorean Theorem states that in a right triangle, the square of the hypotenuse equals the sum of the squares of the other two sides:
Distance Formula
The distance between two points and in the plane is given by:
Example: Find the distance between and .
Midpoint Formula
The midpoint of the segment joining and is:
Example: Find the midpoint between and .
2.2 Graphs of Equations in Two Variables; Intercepts; Symmetry
Equations in Two Variables
An equation in two variables (x and y) is a statement where two expressions involving x and y are equal. The graph of such an equation is the set of all points (x, y) that satisfy the equation.
Example: Does (2, 3) satisfy ? Substitute: (True).
Graphing Equations
Make a table of x-values (inputs) and compute corresponding y-values (outputs).
Plot the resulting (x, y) points on the coordinate plane.
Intercepts
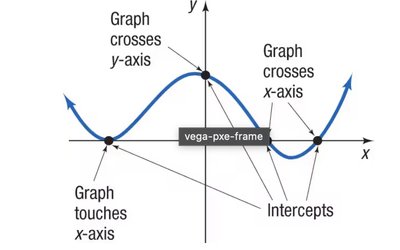
Intercepts are points where a graph crosses or touches the axes.
x-intercept: Set y = 0 and solve for x.
y-intercept: Set x = 0 and solve for y.
There can be multiple x-intercepts but only one y-intercept for a function.
Example: For :
x-intercepts:
y-intercept:
Intercepts: (3, 0), (−1, 0), (0, −3)
Symmetry of Graphs
A graph may be symmetric with respect to the x-axis, y-axis, or the origin:
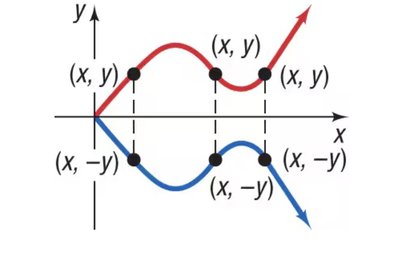
x-axis symmetry: For every (x, y), (x, −y) is also on the graph.
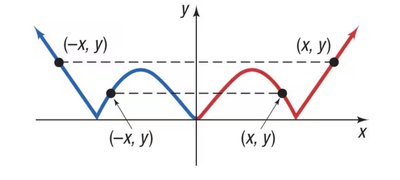
y-axis symmetry: For every (x, y), (−x, y) is also on the graph.
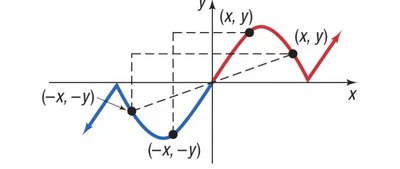
Origin symmetry: For every (x, y), (−x, −y) is also on the graph.
Visualizing Symmetry
x-axis symmetry: Reflects across the x-axis.
y-axis symmetry: Reflects across the y-axis.
Origin symmetry: Rotational symmetry about the origin (180°).
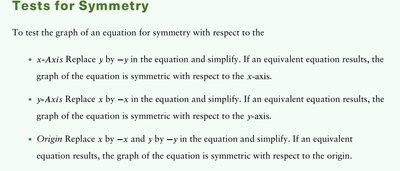
Testing for Symmetry
Type of Symmetry | Test |
|---|---|
x-axis | Replace y with −y in the equation. If the equation is unchanged, the graph is symmetric about the x-axis. |
y-axis | Replace x with −x in the equation. If the equation is unchanged, the graph is symmetric about the y-axis. |
Origin | Replace x with −x and y with −y. If the equation is unchanged, the graph is symmetric about the origin. |
Example: Test for symmetry:
x-axis: Replace y with −y (no y present, so symmetry holds).
y-axis: Replace x with −x: (symmetry holds).
Origin: Replace x with −x and y with −y: (symmetry holds).
Additional info: Symmetry helps in sketching graphs efficiently and understanding the nature of equations.
