Skip to main content
Beginning & Intermediate Algebra
My Course
Learn
AI Tutor
Study Guides
Flashcards
Explore
Try the app
My Course
Learn
AI Tutor
Study Guides
Flashcards
Explore
Try the app
Back
Linear Inequalities in Two Variables definitions
You can tap to flip the card.
Linear Inequality
You can tap to flip the card.
👆
Linear Inequality
A mathematical statement involving two variables and an inequality symbol, representing a region on a graph rather than a single line.
Track progress
Control buttons has been changed to "navigation" mode.
1/15
Related flashcards
Recommended videos
Linear Inequalities in Two Variables quiz
Linear Inequalities in Two Variables
15 Terms
05:47
Intro to Linear Inequalities in Two Variables
70
views
Guided course
7:02
Graphing Linear Inequalities in Two Variable
58
views
Guided course
3:55
Graphing Linear Inequalities in Two Variable Example 1
54
views
Terms in this set (15)
Hide definitions
Linear Inequality
A mathematical statement involving two variables and an inequality symbol, representing a region on a graph rather than a single line.
Ordered Pair
A set of two numbers representing the x and y coordinates of a point, used to test if it satisfies an inequality.
Solution Region
The area on a graph where all points satisfy a given linear inequality, often shown by shading.
Solid Line
A boundary on a graph drawn when the inequality includes equality, indicating points on the line are solutions.
Dashed Line
A boundary on a graph drawn when the inequality excludes equality, indicating points on the line are not solutions.
Slope-Intercept Form
An equation format where y is isolated, making it easier to graph and determine which region to shade for an inequality.
Inequality Symbol
A sign such as <, >, ≤, or ≥ that determines the relationship between two expressions and affects graphing rules.
Test Point
A specific coordinate chosen to check which side of a boundary satisfies the inequality, guiding shading decisions.
Y-Intercept
The point where a line crosses the y-axis, useful for graphing the boundary of a linear inequality.
Standard Form
An equation format ax + by = c, which can be adapted for inequalities to describe boundaries in two variables.
Boundary Line
The line representing the equality part of an inequality, separating solution regions from non-solution regions.
Shaded Region
The portion of a graph marked to show all points that satisfy a linear inequality in two variables.
X-Axis
The horizontal axis on a graph, often used for selecting test points or identifying boundary lines.
Y-Axis
The vertical axis on a graph, useful for plotting points and understanding solution regions.
Multivariable Polynomial
An expression involving more than one variable, forming the basis for equations and inequalities in two dimensions.
 BackBack
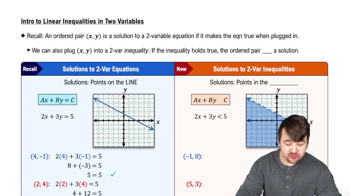
 05:47
05:47
