Back

Ramachandran Plot quiz

Control buttons has been changed to "navigation" mode.
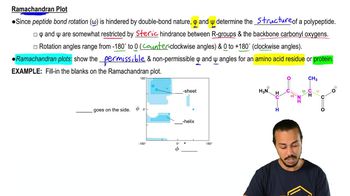
1/15
  • What does the Ramachandran plot display in terms of polypeptide structure?

    It displays the permissible and non-permissible phi and psi bond angles in polypeptides, indicating which conformations are allowed due to steric constraints.
  • Which two bond rotation angles are plotted on a Ramachandran plot?

    The phi (φ) and psi (ψ) bond rotation angles are plotted on a Ramachandran plot.
  • Why is the omega (ω) bond angle not plotted on a Ramachandran plot?

    The omega bond angle is not plotted because its rotation is severely restricted due to the partial double bond character of the peptide bond.
  • What does the phi (φ) angle represent in a polypeptide backbone?

    The phi angle represents the rotation around the alpha carbon-nitrogen bond in the backbone.
  • What does the psi (ψ) angle represent in a polypeptide backbone?

    The psi angle represents the rotation around the alpha carbon-carbonyl carbon bond in the backbone.
  • What restricts the rotation of phi and psi angles in polypeptides?

    Steric hindrance between R groups and backbone carbonyl oxygens restricts the rotation of phi and psi angles.
  • What is the typical range of values for phi and psi angles on a Ramachandran plot?

    Both phi and psi angles typically range from -180 to +180 degrees.
  • On a Ramachandran plot, what do the blue regions indicate?

    The blue regions indicate permissible bond angles where there is minimal steric hindrance.
  • On a Ramachandran plot, what do the white regions indicate?

    The white regions indicate non-permissible bond angles due to steric hindrance.
  • Which axis represents the phi angle on a Ramachandran plot?

    The x-axis represents the phi (φ) bond angles.
  • Which axis represents the psi angle on a Ramachandran plot?

    The y-axis represents the psi (ψ) bond angles.
  • In which quadrant of the Ramachandran plot are alpha helices typically found?

    Alpha helices are typically found in the bottom left quadrant of the Ramachandran plot.
  • In which quadrant of the Ramachandran plot are beta sheets typically found?

    Beta sheets are typically found in the upper left quadrant of the Ramachandran plot.
  • Can a Ramachandran plot be used to analyze a single amino acid residue or an entire protein?

    Yes, it can show phi and psi angles for a single residue or for all residues in a protein.
  • What mnemonic can help you remember that phi is the alpha carbon-nitrogen bond?

    The Greek letter phi (φ) resembles a lowercase 'n', reminding you of the nitrogen atom in the alpha carbon-nitrogen bond.