Skip to main content
General Biology
My Course
Learn
Exam Prep
AI Tutor
Study Guides
Textbook Solutions
Flashcards
Explore
Try the app
My Course
Learn
Exam Prep
AI Tutor
Study Guides
Textbook Solutions
Flashcards
Explore
Try the app
Back
Population Demography definitions
You can tap to flip the card.
Demography
You can tap to flip the card.
👆
Demography
Statistical analysis of population characteristics, focusing on size, structure, distribution, and factors influencing changes.
Track progress
Control buttons has been changed to "navigation" mode.
1/17
Related flashcards
Related practice
Recommended videos
Population Demography exam
Population Demography
28 Terms
Population Demography quiz #2
Population Demography
17 Terms
Population Demography quiz #3
Population Demography
16 Terms
50. Population Ecology
1 topic
3 problems
Chapter
Jason
Guided course
03:49
Life Tables
1697
views
5
rank
Guided course
02:18
Population Demography Example 1
1678
views
3
rank
Guided course
02:54
Survivorship Curves
1572
views
6
rank
Terms in this set (17)
Hide definitions
Demography
Statistical analysis of population characteristics, focusing on size, structure, distribution, and factors influencing changes.
Population Size
Total number of individuals within a defined group, crucial for understanding trends and dynamics.
Population Structure
Composition of a group based on attributes like age or sex, shaping demographic patterns.
Population Distribution
Spatial arrangement of individuals within a defined area, affecting interactions and resource use.
Birth Rate
Frequency of new individuals produced in a group, impacting overall growth and dynamics.
Death Rate
Proportion of individuals dying within a specific time frame, influencing population decline.
Migration
Movement of individuals into or out of a group, altering size and genetic composition.
Life Table
Comprehensive chart summarizing survivorship, mortality, and reproductive rates for a cohort.
Cohort
Group of same-species individuals born around the same time, tracked for demographic analysis.
Survivorship
Proportion of a group remaining alive at the start of each age interval, reflecting longevity.
Mortality Rate
Fraction of individuals dying between age intervals, indicating risk at different life stages.
Fecundity
Average number of female offspring produced per female, highlighting reproductive capacity.
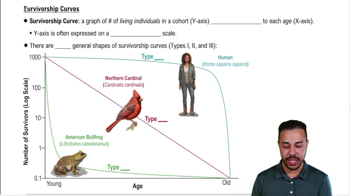
Survivorship Curve
Graphical plot showing the number of living individuals in a cohort across age groups.
Logarithmic Scale
Nonlinear axis used in graphs to display a wide range of values, common in survivorship curves.
Type 1 Survivorship Curve
Pattern with low early mortality and increased death rates in older age, typical of humans.
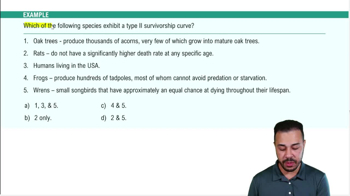
Type 2 Survivorship Curve
Pattern with constant mortality throughout life, resulting in a straight-line graph.
Type 3 Survivorship Curve
Pattern with high early mortality and lower death rates for survivors, common in many amphibians.
 BackBack

 03:49
03:49