 Back
BackBiology 201 Practice Exam Study Guidance
Study Guide - Smart Notes
 Tailored notes based on your materials, expanded with key definitions, examples, and context.
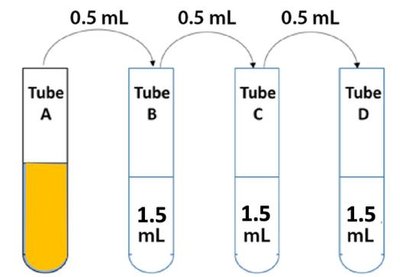
Q1. Express the dilution factor for this dilution series two ways: as a fraction and as a decimal.
Background
Topic: Quantitative analysis of biological processes
This question is testing your understanding of how to calculate dilution factors, which is essential for preparing solutions in biological experiments.
Key Terms and Formulas:
Dilution factor: The ratio of the volume of stock solution to the total volume after dilution.
Fractional form:
Decimal form: (expressed as a decimal)
Step-by-Step Guidance
Examine the diagram: Each tube receives 0.5 mL of stock solution and is brought to a total volume of 2.0 mL (1.5 mL diluent + 0.5 mL stock).
Write the dilution factor for each step:
Convert the fraction to a decimal:
Try solving on your own before revealing the answer!
Final Answer: Fraction: 1/4, Decimal: 0.25
Each dilution step reduces the concentration by a factor of 1/4 (0.25), which is important for creating a series of known concentrations for quantitative analysis.
Q2. If you start with a stock concentration of quinine that is 360 µg/mL in Tube A, what will be the concentration of quinine in Tubes B, C, and D?
Background
Topic: Serial dilution calculations
This question tests your ability to calculate the concentration of a solute after each step in a serial dilution, a common technique in biology labs.
Key Terms and Formulas:
Serial dilution: Repeated dilution of a solution, where each step uses the previous diluted solution as the stock.
Concentration after dilution:
Step-by-Step Guidance
Start with Tube A:
Calculate Tube B: Multiply Tube A's concentration by the dilution factor ().
Calculate Tube C: Multiply Tube B's concentration by the dilution factor ().
Calculate Tube D: Multiply Tube C's concentration by the dilution factor ().
Try solving on your own before revealing the answer!
Final Answer: Tube B = 90 µg/mL, Tube C = 22.5 µg/mL, Tube D = 5.625 µg/mL
Each tube's concentration is calculated by multiplying the previous tube's concentration by 0.25, reflecting the serial dilution process.
Q3. Assume that you put each tube in a spectrophotometer set to 430 nm to measure Absorbance. Why would you select a specific nm?
Background
Topic: Spectrophotometry and absorbance measurement
This question is about understanding why a specific wavelength is chosen for measuring absorbance in a spectrophotometer, which is crucial for accurate quantitative analysis.
Key Terms:
Spectrophotometer: An instrument that measures how much light is absorbed by a sample at a specific wavelength.
Absorbance: The amount of light absorbed by a sample, often related to concentration.
Wavelength (nm): The specific color of light used, chosen based on the maximum absorbance of the compound being measured.
Step-by-Step Guidance
Identify the compound being measured: Quinine.
Determine the wavelength at which quinine absorbs light most strongly (its absorbance maximum).
Explain that selecting this wavelength increases sensitivity and accuracy of the measurement.
Try solving on your own before revealing the answer!
Final Answer: A spectrophotometer is set to the wavelength most strongly absorbed by quinine to maximize accuracy and sensitivity.
Choosing 430 nm ensures that the absorbance readings are most responsive to changes in quinine concentration.
Q4. Now make a quinine standard curve using your calculations in #2 and the absorbance values below: Tube A: 0.82, Tube B: 0.28, Tube C: 0.15, Tube D: 0.11. Plot a graph of Absorbance as a function of quinine concentration (µg/mL) showing the data points and trend.
Background
Topic: Standard curve construction in quantitative biology
This question tests your ability to graph data and interpret the relationship between concentration and absorbance, which is fundamental for determining unknown concentrations.
Key Terms:
Standard curve: A graph showing the relationship between known concentrations and measured absorbance values.
Absorbance: Measured value from the spectrophotometer.
Concentration: Amount of quinine in each tube.
Step-by-Step Guidance
List the concentrations and absorbance values for each tube.
Plot concentration (x-axis) vs. absorbance (y-axis) for each tube.
Draw a best-fit line or curve through the data points to show the trend.
Label axes and data points clearly.
Try solving on your own before revealing the answer!
Final Answer: The standard curve is a plot of absorbance (y-axis) vs. quinine concentration (x-axis), showing a positive linear trend.
This curve allows you to determine unknown concentrations by measuring absorbance and using the trend line equation.
Q5. If your graph produced the best-fit line y = 0.002x + 0.1, what would the quinine concentration of a bark extract be if it had an absorbance of 0.66?
Background
Topic: Using standard curves to determine unknown concentrations
This question tests your ability to use the equation of a best-fit line to solve for an unknown concentration based on absorbance.
Key Terms and Formulas:
Best-fit line equation:
Absorbance (y): Measured value
Concentration (x): Unknown value to solve for
Step-by-Step Guidance
Write the equation:
Plug in the absorbance value:
Subtract 0.1 from both sides to isolate the term with x.
Divide by 0.002 to solve for x (concentration).
Try solving on your own before revealing the answer!
Final Answer: 280 µg/mL
By rearranging the equation and solving for x, you find the concentration that corresponds to the measured absorbance.
Q6. What would the concentration of quinine be in the bark sample in mg/L? (Show your calculations.)
Background
Topic: Unit conversion in quantitative biology
This question tests your ability to convert units, which is important for reporting results in standard scientific formats.
Key Terms and Formulas:
Unit conversion:
Concentration: Amount of quinine in the sample
Step-by-Step Guidance
Recall the conversion factor:
Take the concentration found in the previous step (in ) and convert it to .
Try solving on your own before revealing the answer!
Final Answer: 280 mg/L
The conversion is direct, as 1 µg/mL equals 1 mg/L, so the concentration remains numerically the same but in different units.
