Back
Patterns of Inheritance: Mendelian and Non-Mendelian Genetics
Study Guide - Smart Notes
 Tailored notes based on your materials, expanded with key definitions, examples, and context.
Patterns of Inheritance
Introduction to Mendelian Genetics
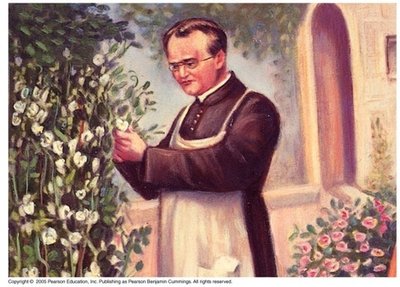
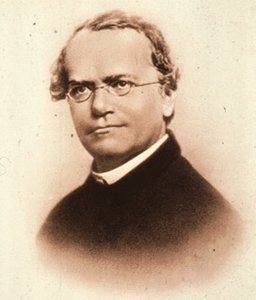
The study of inheritance patterns began with the pioneering work of Gregor Mendel, who established the basic principles of heredity through experiments with garden pea plants. Mendel's discoveries form the foundation of classical genetics, explaining how traits are passed from one generation to the next.
Gregor Mendel: Monk, mathematician, and scientist who discovered the basic principles of heredity.
Mendelian Genetics: The study of how traits are inherited according to Mendel's laws.
Advantages of Pea Plants for Genetic Study
Mendel chose pea plants (Pisum sativum) for his experiments due to several advantageous characteristics:
Many varieties with distinct heritable features (characters), such as flower color and seed shape.
Traits (character variations) are easily observable.
Mating can be controlled (cross-pollination is possible).
Large numbers of offspring are produced quickly.
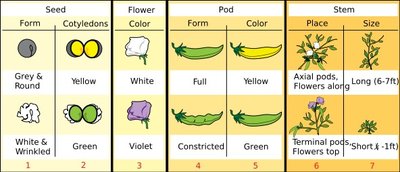
Mendel’s Experimental Design
Mendel studied seven distinct traits in pea plants, examining one trait per experiment. He used true-breeding plants (homozygous for a trait) and performed hybridization to observe inheritance patterns across generations.
P Generation: True-breeding parents.
F1 Generation: Hybrid offspring of the P generation.
F2 Generation: Offspring from self-pollination of F1 individuals.
Dominant and Recessive Traits
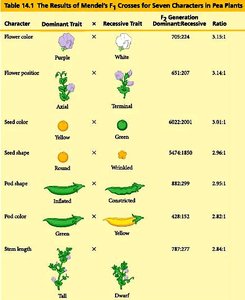
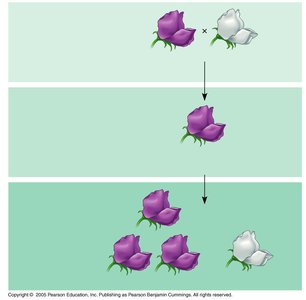
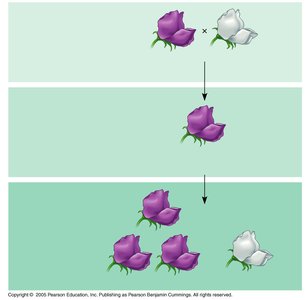
Mendel observed that certain traits (e.g., purple flower color) appeared in the F1 generation, while others (e.g., white flower color) reappeared in the F2 generation. He concluded that:
Dominant trait: Expressed if at least one dominant allele is present.
Recessive trait: Expressed only if two recessive alleles are present.
The "heritable factor" is now known as a gene.
Disproving the Theory of Blending
Mendel's results contradicted the theory of blending inheritance, which proposed that offspring are a mix of parental traits. Instead, Mendel showed that traits are inherited as discrete units (genes).
F1 generation showed only the dominant trait.
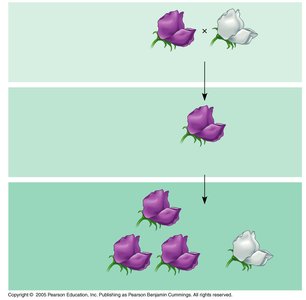
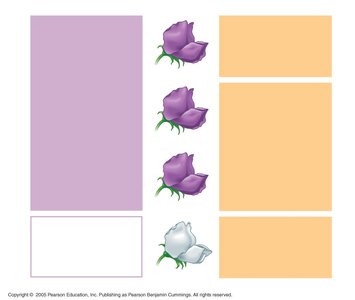
F2 generation showed both dominant and recessive traits in a 3:1 ratio.
Genotype and Phenotype
The genotype is the genetic makeup of an organism, while the phenotype is the observable physical appearance. Different genotypes can produce the same phenotype if a dominant allele is present.
Homozygous: Two identical alleles (e.g., PP or pp).
Heterozygous: Two different alleles (e.g., Pp).
Punnett Squares
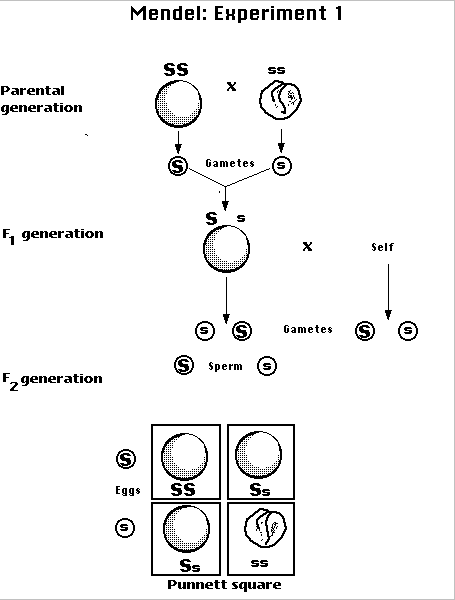
A Punnett square is a diagram used to predict the outcome of a genetic cross. Capital letters represent dominant alleles, and lowercase letters represent recessive alleles.
Used to determine genotypic and phenotypic ratios of offspring.
Test Cross
A test cross is used to determine the genotype of an individual with a dominant phenotype by crossing it with a homozygous recessive individual. The appearance of recessive offspring indicates a heterozygous genotype.
If all offspring show the dominant phenotype, the parent is likely homozygous dominant.
If some offspring show the recessive phenotype, the parent is heterozygous.
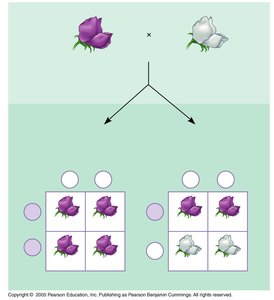
Law of Independent Assortment
Mendel's second law states that each pair of alleles segregates independently during gamete formation. This law applies to genes on different, nonhomologous chromosomes.
Dihybrid cross: Cross between individuals heterozygous for two traits.
Results in a 9:3:3:1 phenotypic ratio in the F2 generation.
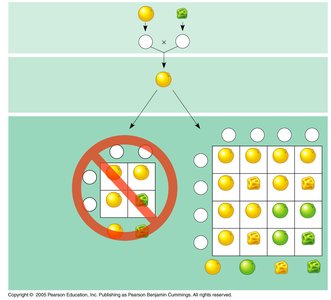
Non-Mendelian Inheritance
Codominance
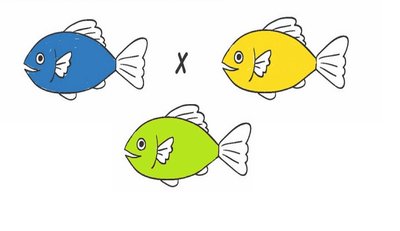
In codominance, both alleles are fully expressed in heterozygotes, resulting in both parental phenotypes appearing together.
Example: Black and white chickens produce speckled offspring.
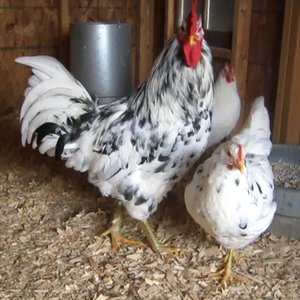
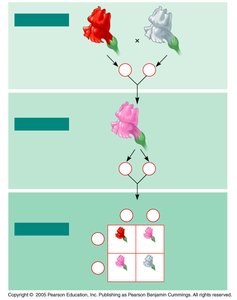
Incomplete Dominance
In incomplete dominance, the heterozygote displays a phenotype intermediate between the two parental varieties.
Example: Straight hair and curly hair produce wavy hair in heterozygotes.
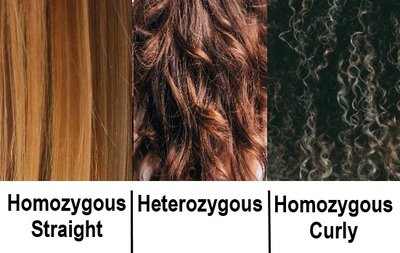
Multiple Alleles
Some genes have more than two allelic forms in a population. The ABO blood group in humans is determined by three alleles: IA, IB, and i.
Four blood types: A, B, AB, O.
Polygenic Inheritance
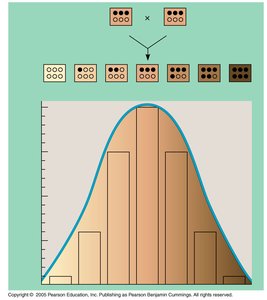
Polygenic inheritance occurs when multiple genes influence a single trait, resulting in continuous variation (e.g., skin color, weight).
Traits show a bell-shaped distribution in the population.
Environmental Influence (Multifactorial Traits)
Phenotypes can be influenced by both genotype and environmental factors. The norm of reaction describes the range of phenotypes produced by a genotype under different environmental conditions.
Example: Hydrangea flower color varies with soil acidity.
Chromosomal Basis of Inheritance
Morgan’s Experiments with Fruit Flies
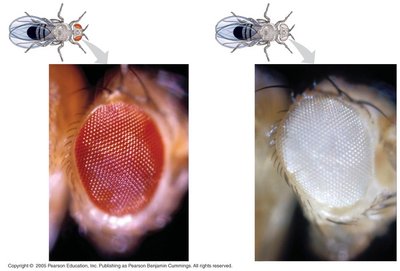
Thomas Hunt Morgan provided evidence that genes are located on chromosomes through experiments with fruit flies (Drosophila melanogaster).
Discovered sex-linked inheritance patterns.
Showed that the white-eye mutation is located on the X chromosome.
Sex-Linked Genes
Genes located on sex chromosomes (X or Y) are called sex-linked genes. These genes often show unique inheritance patterns, especially for X-linked traits.
Examples of X-linked disorders: color blindness, Duchenne muscular dystrophy, hemophilia.
Pedigree Analysis
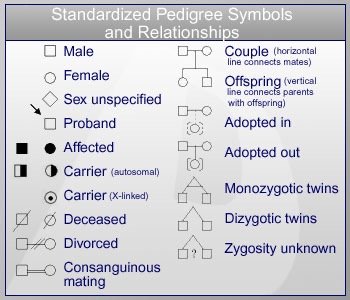
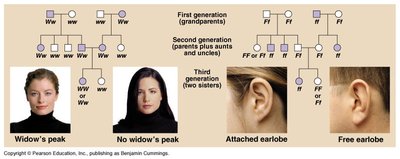
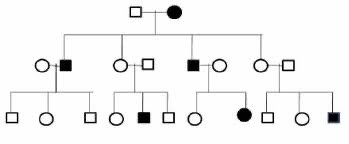
Pedigree analysis is used to study inheritance patterns in humans by examining family histories. Pedigrees help determine genotypes based on observed phenotypes across generations.
Symbols are used to represent individuals and relationships.
Can reveal carriers and affected individuals for genetic disorders.