 Back
BackScientific Process, Graphing, and Structure of DNA – Study Notes
Study Guide - Smart Notes
 Tailored notes based on your materials, expanded with key definitions, examples, and context.
Scientific Process and Biological Inquiry
Nature of Science and the Scientific Method
The scientific method is a systematic approach used by scientists to investigate natural phenomena, develop hypotheses, and test predictions. It is foundational to biological research and ensures that scientific knowledge is based on empirical evidence.
Observation: Gathering information about the natural world through senses or instruments.
Question: Formulating a question based on observations.
Hypothesis: A testable explanation for an observation or scientific problem.
Experiment: Designing and conducting experiments to test the hypothesis.
Results (Data): Collecting and analyzing data from experiments.
Conclusion: Drawing conclusions based on data; hypotheses may be supported or refuted.
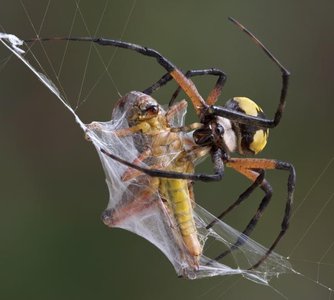
Example: Observing that garden spiders "write" in their webs leads to the question: What are the benefits of writing in the webs?
Hypotheses, Theories, and Scientific Reasoning
Hypothesis: A specific, testable prediction (e.g., "Garden spider webs with more writing will trap more insects").
Null Hypothesis: A statement that there is no effect or difference (e.g., "The amount of writing in the web does not affect the number of insects trapped").
Scientific Theory: A broad explanation for a wide range of phenomena, supported by extensive evidence (e.g., theory of evolution). In science, a theory is much stronger than a hypothesis.
Causation vs. Correlation: Causation implies one variable directly affects another, while correlation indicates a relationship without direct causality.
Graphing Data in Biological Experiments
Types of Graphs and Their Uses
Graphs are essential tools for visualizing and interpreting experimental data. The choice of graph depends on the type of data and the relationship being examined.
Bar Graph: Used for categorical data to compare quantities across categories.
Line Graph: Used for continuous data to show trends over time or ordered categories.
Scatter Plot: Used to display the relationship between two continuous variables.
Pie Chart: Used to show proportions of a whole (less common in biological research).
Box & Whisker Plot: Used to show the distribution, median, and variability of data.
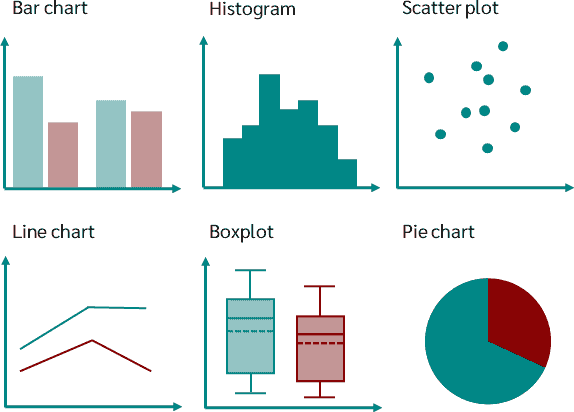
Key Points:
X-axis: Independent variable (what is manipulated).
Y-axis: Dependent variable (what is measured).
Continuous data is best visualized with line graphs or scatter plots; categorical data with bar or box plots.
Case Study: Spider Webs and Scientific Investigation
Experimental Design Example
To test the hypothesis that writing in spider webs increases insect capture, scientists manipulate the amount of writing (independent variable) and measure the number of insects trapped (dependent variable).
Independent Variable: Amount of writing in the web (% web covered with zig-zag writing).
Dependent Variable: Number of insects trapped over 72 hours.
Graph Selection: For this experiment, a bar graph or box & whisker plot is appropriate to compare insect capture across different writing amounts.
The Structure of DNA
Overview and Biological Importance
Deoxyribonucleic acid (DNA) is the molecule that stores genetic information in all living organisms. Its structure allows for stable information storage, accurate replication, and evolutionary change.
DNA is a nucleic acid, a polymer made up of monomers called nucleotides.
DNA is found in the nucleus of eukaryotic cells and in the cytoplasm of prokaryotic cells.
Chromosomes are structures composed of DNA and proteins, carrying genes that determine traits.
Primary Structure of DNA: Nucleotide Composition
Each nucleotide consists of three components:
Phosphate group
Deoxyribose sugar (in DNA; ribose in RNA)
Nitrogenous base (Adenine, Thymine, Guanine, Cytosine)
Nucleotides are linked by phosphodiester bonds between the 3’ hydroxyl group of one sugar and the 5’ phosphate of the next.
Directionality: DNA strands have a 5’ end (phosphate group) and a 3’ end (hydroxyl group). New nucleotides are added to the 3’ end during replication.
Secondary Structure of DNA: The Double Helix
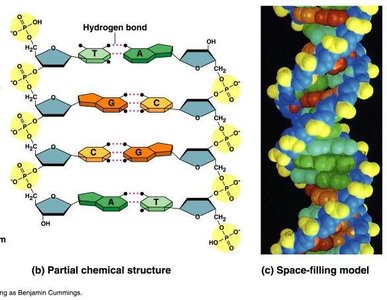
DNA’s secondary structure is a double helix formed by two antiparallel strands held together by hydrogen bonds between complementary bases.
Base Pairing Rules: Adenine (A) pairs with Thymine (T); Guanine (G) pairs with Cytosine (C).
Pyrimidines: Single-ring bases (Cytosine, Thymine, Uracil).
Purines: Double-ring bases (Adenine, Guanine).
Antiparallel Strands: One strand runs 5’ to 3’, the other 3’ to 5’.
Hydrogen Bonds: Hold the two strands together (A-T: 2 bonds; G-C: 3 bonds).
Chargaff’s Rule: In double-stranded DNA, %A = %T and %C = %G.
Tertiary Structure: Chromosome Organization
In eukaryotes, DNA wraps around histone proteins to form nucleosomes, which further coil and fold to form chromosomes. This compaction is essential for fitting large genomes into the cell nucleus and for regulating gene expression.
DNA Replication
DNA replication is the process by which DNA makes a copy of itself during cell division. It is semi-conservative: each new DNA molecule consists of one old (parental) strand and one new (daughter) strand.
Key Steps: Parental strands separate; new nucleotides are added to the 3’ end of each template strand.
Hydrogen bonds between base pairs are broken to allow strand separation.
Phosphodiester bonds are formed to link new nucleotides into the growing strand.
Example Question: During replication, which bonds must be split to create new DNA molecules? Answer: The hydrogen bonds between the paired nitrogenous bases.
Summary Table: DNA and RNA Comparison
Source | %A | %G | %T | %C | %U | DNA or RNA? | Single or Double Stranded? |
|---|---|---|---|---|---|---|---|
1 | 20 | 30 | 0 | 10 | 40 | RNA | Single stranded |
2 | 20 | 30 | 20 | 30 | 0 | DNA | Double stranded |
3 | 20 | 20 | 30 | 30 | 0 | DNA | Single stranded |
Key Equations and Concepts
Phosphodiester Bond Formation:
Base Pairing:
Practice: DNA Complementarity
Given a DNA strand: 3’ ATTAGCGGCTAG 5’ The complementary strand is: 5’ TAATCGCCGATC 3’
Summary
The scientific method is essential for biological inquiry and hypothesis testing.
Graph selection depends on data type and experimental design.
DNA’s structure—from nucleotide composition to double helix and chromosome organization—enables genetic information storage, replication, and inheritance.
