- Download the worksheet to save time writing
- Start solving the practice problems
- If you're stuck, watch the video solutions
- See your summary to get more insights

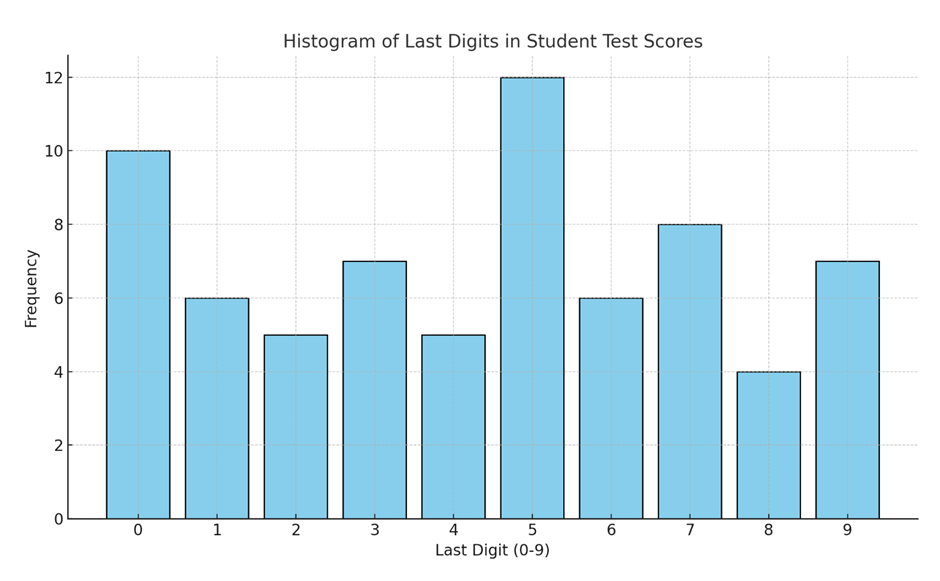
Shown below is a histogram of the last digits (units place) of scores from a large set of test results from a high school math department. Each score is out of , and the last digit ( through ) is recorded for analysis. Identify the frequencies of each digit. Then, test the claim that the last digits of the scores are uniformly distributed—that is, each digit from to is equally likely. Use level of significance. Does the data suggest any potential grading bias or irregularity in how scores are assigned?
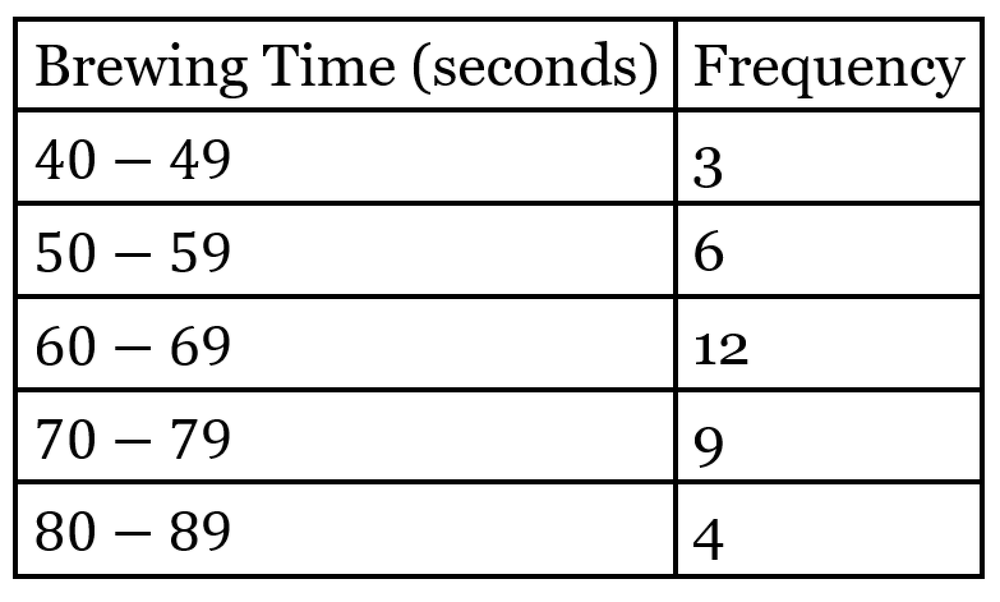
Create a histogram using the frequency distribution of coffee brewing times (in seconds) shown below.
Does the histogram appear to show data from a normal distribution when the requirements for normal distribution are strictly applied?
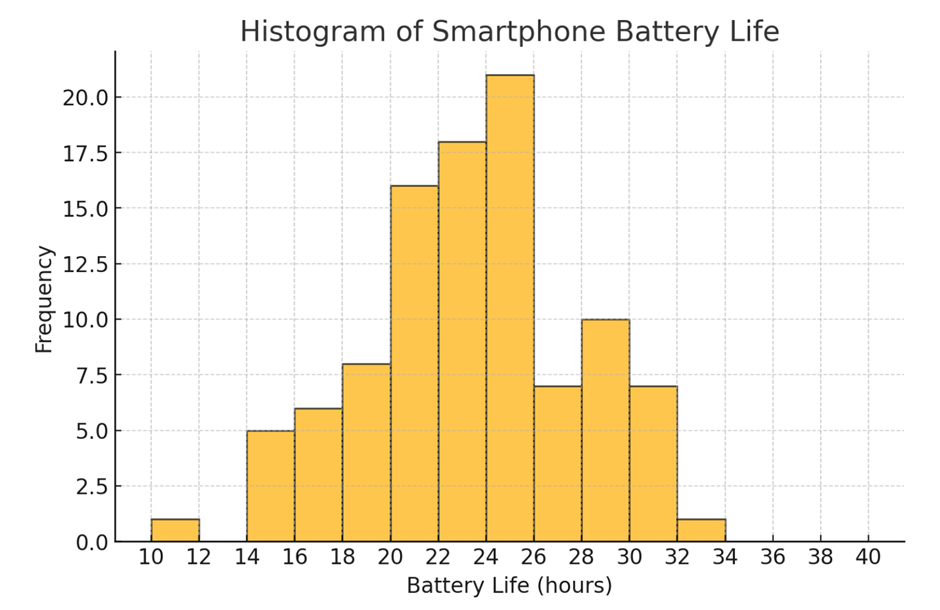
Use the following histogram generated by statistical software, which represents the battery life (in hours) of a sample of smartphones. (The values on the horizontal scale are rounded.)
What is the approximate number of smartphones represented in the three bars farthest to the right?
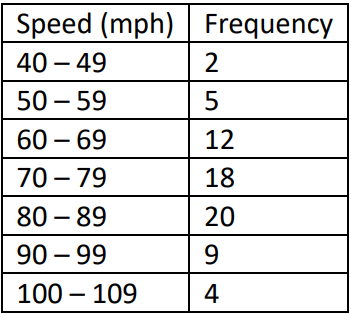
Vehicle Speeds on a Highway: Utilizing the following frequency distribution data, construct a histogram to answer the given question: Does the histogram appear to be skewed? If so, identify the type of skewness.
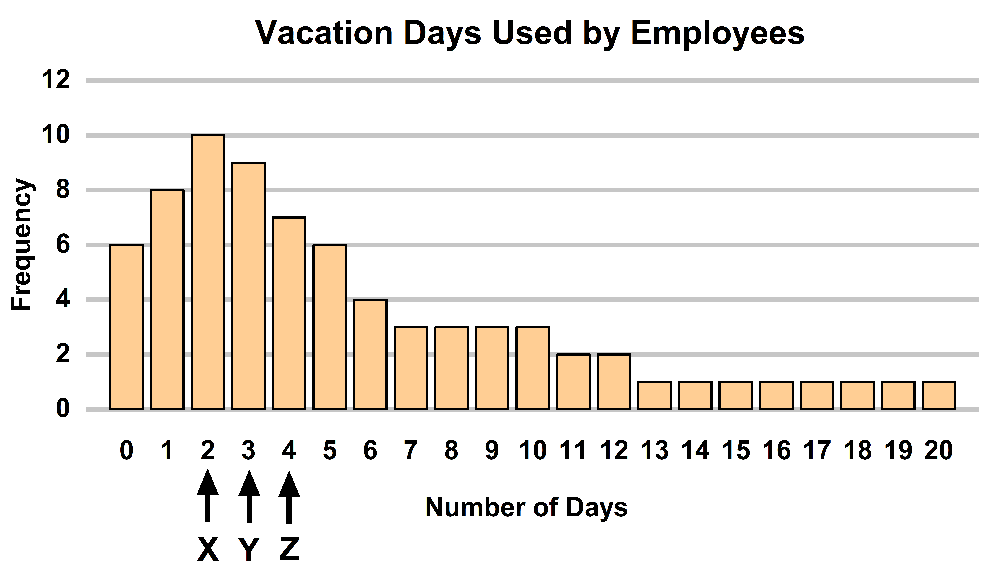
The histogram below shows the number of vacation days used by employees in a company over the past year. The letters X, Y, and Z are marked at various points on the horizontal axis. Describe the shape of the data distribution and determine which letter (X, Y, or Z) corresponds to the mean, median, and mode.
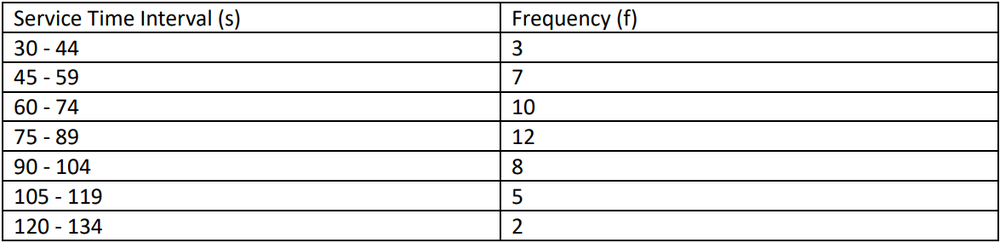
A researcher recorded the drive-thru service times (in seconds) at a local fast-food restaurant during dinner hours. Construct a histogram for yourself using the provided frequency distribution and answer the following question: Using a strict interpretation of the criteria for normality, does the histogram suggest the data follows a normal distribution?