- Download the worksheet to save time writing
- Start solving the practice problems
- If you're stuck, watch the video solutions
- See your summary to get more insights

A market researcher wants to estimate the difference in proportions of two brands' repeat customers. She requires the estimate to be within with confidence and has no prior proportion estimates. What total sample size should she plan to collect?
What is the correct null hypothesis when testing if two population proportions are equal?
An academic advisor claims that there is a significant correlation between the number of hours students study per week and their scores on a standardized math test. The data below shows the weekly study time and math test scores for 8 randomly selected students:
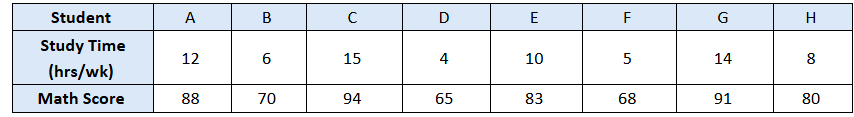
At , is there enough evidence to support the advisor’s claim that a significant correlation exists between weekly study time and math performance?
A new medication is being tested for its side effects. In a clinical study, out of patients treated with the new medication reported headaches, while out of patients in the placebo group reported headaches. At the significance level, use a hypothesis test to test if there is evidence of a difference in the rate of headaches between the new medication and placebo groups. Does headache appear to be a side effect of the new medication?
In a survey of high school students who participate in extracurricular activities, reported that they plan to attend college. In a separate survey of students who do not participate in extracurricular activities, reported plans to attend college. At the significance level, can you support the claim that a higher proportion of students who participate in extracurricular activities plan to attend college compared to those who do not?
Check if the requirements for applying a normal distribution to compare two population proportions are met. If they are, conduct a test of the claim using the specified significance level. Assume the samples are randomly chosen and independent.
Claim: ,
Sample statistics:
Group : successes out of trials
Why is a pooled estimate of the population proportion used in a two-sample hypothesis test () for proportions, but not used when constructing a confidence interval for the difference between two proportions ()?
A study investigates the effectiveness of a new safety helmet for cyclists. Out of cyclists not wearing the new helmet, suffered serious head injuries. Out of cyclists wearing the new helmet, suffered serious head injuries. At the significance level, test the claim using a hypothesis test that the new helmet reduces the risk of serious head injury.
A new medication, PainAway, is being tested for its side effects. In a clinical study, out of patients treated with PainAway reported headaches, while out of patients in the placebo group reported headaches. At the significance level, use an appropriate confidence interval to identify if there is evidence of a difference in the rate of headaches between the PainAway and placebo groups.
A psychologist wants to compare the variability in reaction times between two groups: those who slept hours, with a sample size of and a standard deviation of seconds, and those who slept hours, with a sample size of and a standard deviation of seconds. At the significance level, test the claim that both groups have the same amount of variation in reaction times.