Skip to main content
Statistics for Business
My Course
Learn
Exam Prep
AI Tutor
Study Guides
Flashcards
Explore
Try the app
My Course
Learn
Exam Prep
AI Tutor
Study Guides
Flashcards
Explore
Try the app
Back
Two Means - Unknown, Equal Variances Hypothesis Test - Excel definitions
You can tap to flip the card.
Pooled t Test
You can tap to flip the card.
👆
Pooled t Test
Statistical method for comparing two means when population variances are assumed equal but unknown.
Track progress
Control buttons has been changed to "navigation" mode.
1/15
Related flashcards
Related practice
Recommended videos
Two Means - Unknown, Equal Variances Hypothesis Test - Excel quiz
Two Means - Unknown, Equal Variances Hypothesis Test - Excel
15 Terms
10. Hypothesis Testing for Two Samples
3 topics
15 problems
Chapter
Ally
Guided course
05:54
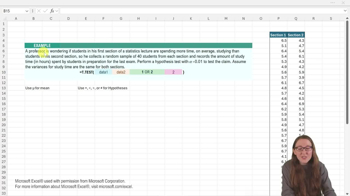
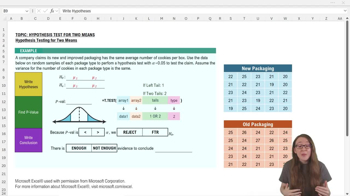
Two Means Unknown, Equal Variances Hypothesis Test - Excel
68
views
Guided course
04:00
Two Means Unknown, Equal Variances Hypothesis Test - Excel Example 1
53
views
1
rank
Terms in this set (15)
Hide definitions
Pooled t Test
Statistical method for comparing two means when population variances are assumed equal but unknown.
Null Hypothesis
Assumption that two population means are equal, serving as the starting point for statistical testing.
Alternative Hypothesis
Statement suggesting a difference exists between two population means, challenging the null hypothesis.
Alpha Level
Threshold probability, such as 0.05, used to determine statistical significance in hypothesis testing.
p Value
Probability measure indicating the strength of evidence against the null hypothesis in a statistical test.
Excel T.TEST Function
Spreadsheet tool that calculates the probability value for comparing means, with options for test type.
Type Input
Parameter in Excel’s T.TEST function specifying the test variant, with '2' indicating the pooled t test.
Two-Tailed Test
Statistical test evaluating whether two means differ in either direction, not just greater or less.
Variance Assumption
Condition that both populations have equal variability, justifying use of the pooled t test.
Sample Data
Observed values from each group, used as input for statistical analysis and hypothesis testing.
Statistical Significance
Conclusion that observed results are unlikely due to chance, typically when p value is below alpha.
Conclusion Statement
Final interpretation of test results, indicating whether evidence supports or rejects the null hypothesis.
Random Samples
Data subsets selected without bias from each population, ensuring valid statistical inference.
Standard Deviation
Measure of data spread within each group, assumed equal for the pooled t test but value unknown.
Test Statistic
Numerical summary of sample data used to assess evidence against the null hypothesis, often bypassed in Excel.
 BackBack
 05:54
05:54