Skip to main content
College Algebra
My Course
Learn
Exam Prep
AI Tutor
Study Guides
Textbook Solutions
Flashcards
Explore
Try the app
My Course
Learn
Exam Prep
AI Tutor
Study Guides
Textbook Solutions
Flashcards
Explore
Try the app
Back
Graphing Polynomial Functions quiz
You can tap to flip the card.
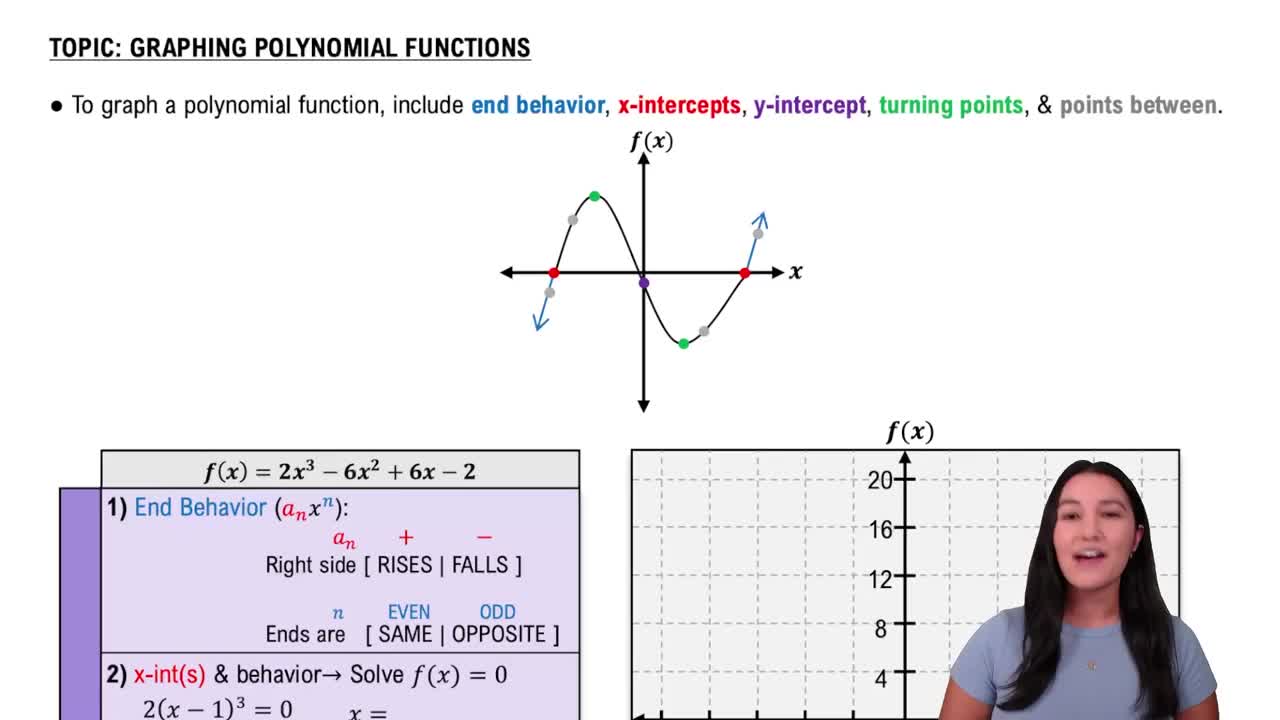
What information do you need to start graphing a polynomial function?
You can tap to flip the card.
👆
What information do you need to start graphing a polynomial function?
You need to identify known points such as x-intercepts, y-intercepts, and turning points, as well as determine the end behavior.
Track progress
Control buttons has been changed to "navigation" mode.
1/15
Related flashcards
Related practice
Recommended videos
Graphing Polynomial Functions definitions
Graphing Polynomial Functions
15 Terms
Graphing Polynomial Functions
4. Polynomial Functions
6 problems
Topic
Justin
Dividing Polynomials
4. Polynomial Functions
4 problems
Topic
Callie
4. Polynomial Functions
5 topics
11 problems
Chapter
Callie
09:43
Example 1
1622
views
25
rank
05:01
Identifying Intervals of Unknown Behavior
2494
views
41
rank
1
comments
05:25
Graphing Polynomial Functions
1863
views
30
rank
Terms in this set (15)
Hide definitions
What information do you need to start graphing a polynomial function?
You need to identify known points such as x-intercepts, y-intercepts, and turning points, as well as determine the end behavior.
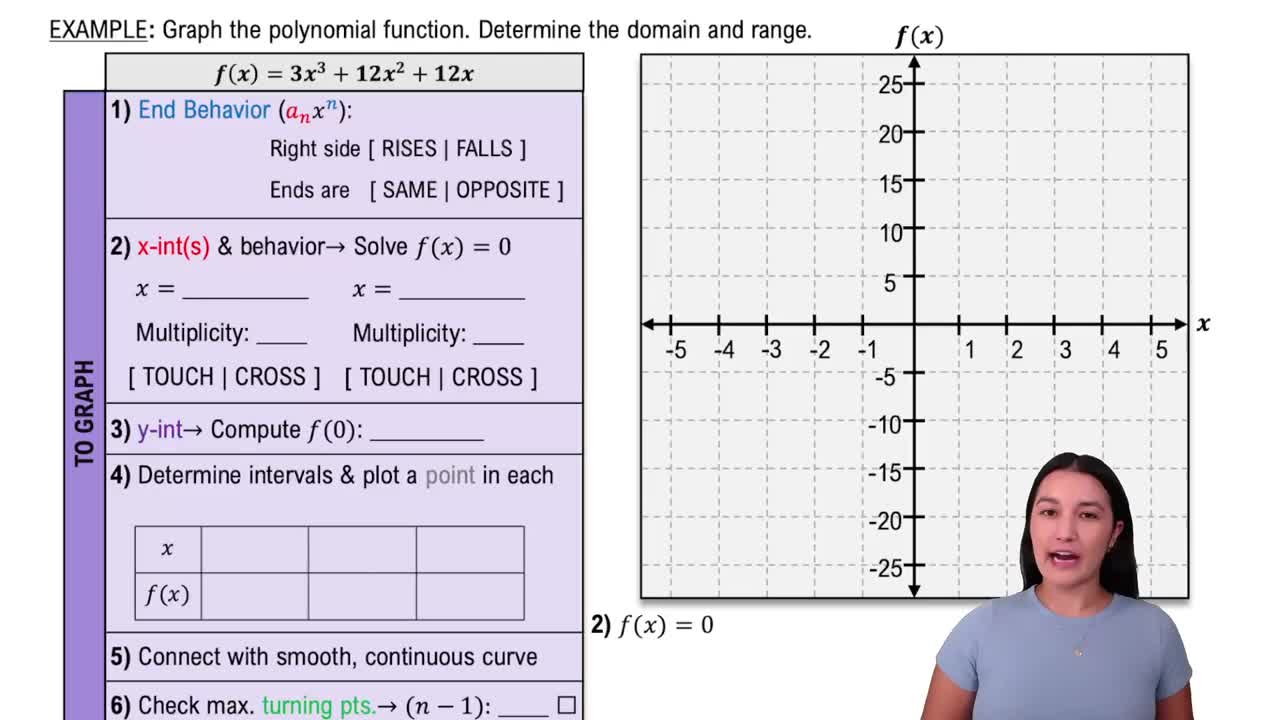
How do you determine the end behavior of a polynomial function?
The end behavior is determined by the leading coefficient and the degree of the polynomial.
What is the process for finding x-intercepts of a polynomial function?
Set the polynomial equal to zero and solve for x to find the x-intercepts.
How do you find the y-intercept of a polynomial function?
Evaluate the polynomial at x = 0 to find the y-intercept.
What does the multiplicity of an x-intercept tell you about the graph at that point?
Multiplicity tells you whether the graph crosses the x-axis (odd multiplicity) or touches and turns around (even multiplicity).
How can you fill in unknown intervals on the graph of a polynomial function?
Select x-values within the unknown intervals, calculate their f(x) values, and plot these points to clarify the graph's shape.
What is the maximum number of turning points a polynomial function can have?
The maximum number of turning points is the degree of the polynomial minus one.
Why is it important to plot points in unknown intervals when graphing a polynomial?
Plotting points in unknown intervals helps reveal the graph's behavior between known points, making the graph more accurate.
What should you do after plotting all known and calculated points on a polynomial graph?
Connect all points with a smooth, continuous curve to complete the graph.
How do you check if your polynomial graph is correct regarding turning points?
Verify that the number of turning points does not exceed the degree minus one.
What is the significance of the leading coefficient being positive in a cubic polynomial?
A positive leading coefficient means the graph rises on the right side as x approaches infinity.
How does the degree of a polynomial affect its end behavior?
An odd degree means the ends of the graph go in opposite directions; an even degree means both ends go the same way.
What is a good strategy for choosing x-values in unknown intervals?
Choose x-values that are easy to plot and provide useful information about the graph's shape.
What happens at an x-intercept with odd multiplicity?
The graph crosses the x-axis at that point.
What is the final step in graphing a polynomial function?
The final step is to check the number of turning points and ensure the graph matches the expected end behavior.
 BackBack

 09:43
09:43