Skip to main content
General Chemistry
My Course
Learn
Exam Prep
AI Tutor
Study Guides
Textbook Solutions
Flashcards
Explore
My Course
Learn
Exam Prep
AI Tutor
Study Guides
Textbook Solutions
Flashcards
Explore
Back
18. Aqueous Equilibrium - Part 2 of 3
Download worksheet
Problem 1
Problem 2
Problem 3
Problem 4
Problem 5
Problem 6
Problem 7
Problem 8
Problem 9
Problem 10
Problem 11
Problem 12
Problem 13
18. Aqueous Equilibrium - Part 2 of 3
Download worksheet
Practice
Summary
Previous
6 of 13
Next
18. Aqueous Equilibrium / Weak Titrate-Strong Titrant Curves / Problem 6
Problem 6
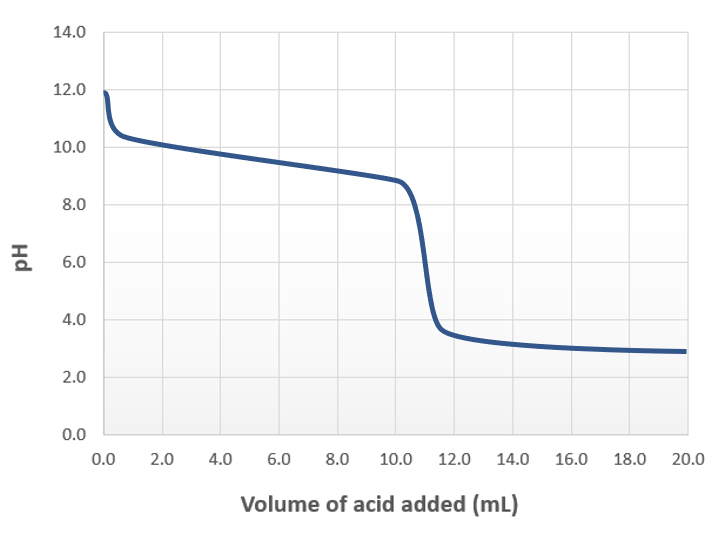
The image below shows the titration of a weak base with a strong acid.
Determine the volume of added acid where the equilibrium concentration of the species in the solution and Ka of the conjugate acid is used to calculate pH.
A
1.00 mL
B
6.00 mL
C
11.00 mL
D
16.00 mL
AI tutor
0
Show Answer