19. Chemical Thermodynamics / Gibbs Free Energy / Problem 1
In state A, two ideal gases (represented by yellow and green spheres) initially occupy two separate bulbs. When the stopcock is opened, the two ideal gases went from state A to state B. Relate states A and B to the graph. 
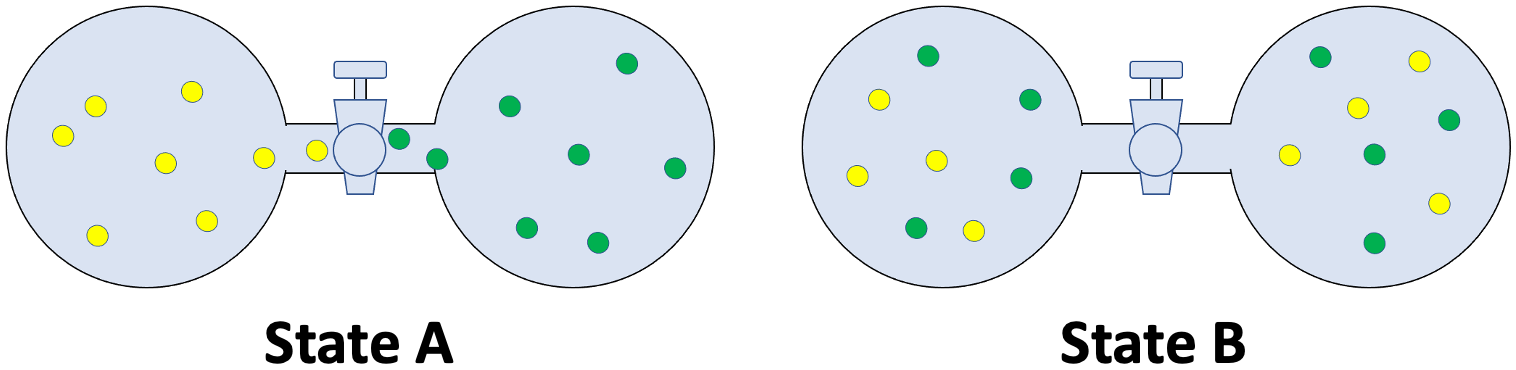
The spontaneous (ΔG < 0) process of going from State A to State B can be represented by the decreasing (from left to right) curve left side of the minimum/lowest point of the graph. Going from State B to another new state can be represented by the increasing (from left to right) curve right side of the minimum/lowest point of the graph since this process is non-spontaneous (ΔG > 0).
States A and B are both best represented by the minimum/lowest point (ΔG = 0) of the graph.
The process of going from States A to B and from State B back to A are essentially spontaneous (ΔG < 0) and are well represented by the decreasing (from left to right) curve left side of the minimum/lowest point of the graph.
The process (ΔG > 0) of going from State A to State B can be represented by the increasing (from left to right) curve right side of the minimum/lowest point of the graph. Going from State B to another new state (ΔG < 0) can be represented by the decreasing (from left to right) curve left side of the minimum/lowest point of the graph.
AI tutor 0