 Back
BackAcid-Base Titrations and Indicators: Aqueous Ionic Equilibria
Study Guide - Smart Notes
 Tailored notes based on your materials, expanded with key definitions, examples, and context.
Acid-Base Titrations
Introduction to Acid-Base Titrations
Acid-base titrations are analytical techniques used to determine the concentration of an acid or base by reacting it with a base or acid of known concentration. The titration process involves the gradual addition of one solution to another while monitoring the pH change, which is typically represented as a titration curve.
Equivalence Point: The point at which the amount of acid equals the amount of base during the titration, resulting in complete neutralization.
Indicator: A substance used to visually signal the equivalence point by changing color at a specific pH range.
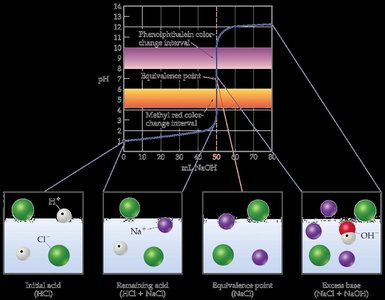
Strong Acid–Strong Base Titration Curves
When a strong acid is titrated with a strong base, the acid is completely ionized in solution. The titration curve shows a rapid pH increase near the equivalence point, which is always at pH 7 due to the neutral nature of the resulting salt solution.
Initial pH: Low, due to high concentration of H3O+.
No Buffer Region: The solution does not resist pH changes before the equivalence point.
Equivalence Point: pH = 7.00, determined by the auto-ionization of water.
Post-Equivalence: pH is controlled by excess OH− from the added strong base.
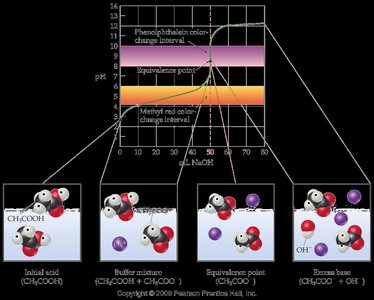
Weak Acid–Strong Base Titration Curves
In the titration of a weak acid with a strong base, the weak acid only partially ionizes. The titration curve features a buffer region and a basic equivalence point due to the hydrolysis of the conjugate base formed at equivalence.
Initial pH: Higher than a strong acid of the same concentration due to incomplete ionization.
Buffer Region: Exists before the equivalence point, where both the weak acid and its conjugate base are present.
Equivalence Point: pH > 7, as the conjugate base hydrolyzes to produce OH−.
Post-Equivalence: pH is controlled by excess strong base.
Key Calculations in Weak Acid–Strong Base Titrations
ICE Table: Used to calculate concentrations of species at various points in the titration.
Henderson-Hasselbalch Equation: Used in the buffer region to calculate pH:
At Halfway Point: (when [HA] = [A−])
At Equivalence Point: Solution contains only the conjugate base; calculate pH using hydrolysis and .
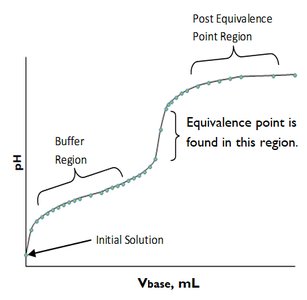
Generic Titration Curve Features
The titration curve for a weak acid and strong base typically includes three regions: the buffer region, the equivalence point region, and the post-equivalence region. The equivalence point is identified by a sharp rise in pH.
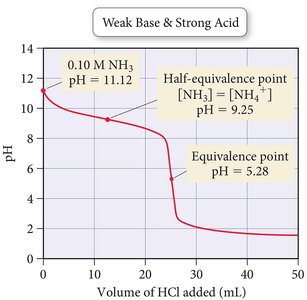
Weak Base–Strong Acid Titration Curves
When a weak base is titrated with a strong acid, the initial pH is higher than that of a weak acid, but lower than a strong base. The titration curve features a buffer region and an acidic equivalence point due to the hydrolysis of the conjugate acid formed at equivalence.
Initial pH: Lower than a strong base of the same concentration.
Buffer Region: Exists before the equivalence point, where both the base and its conjugate acid are present.
Equivalence Point: pH < 7, as the conjugate acid hydrolyzes to produce H3O+.
Post-Equivalence: pH is controlled by excess strong acid.
Strong Acid–Strong Base vs. Weak Base–Strong Acid Titration Curves
Strong acid–strong base titrations have a sharp equivalence point at pH 7, while weak base–strong acid titrations have a lower equivalence point due to the acidic nature of the conjugate acid. The choice of indicator depends on the expected pH at the equivalence point.
Titration of Polyprotic Acids (e.g., Diprotic Acids)
Polyprotic acids, such as H2A, have more than one ionizable proton and thus exhibit multiple equivalence points and buffer regions during titration with a strong base.
First Buffer Region: H2A/HA−, pH = pKa1 + log([HA−]/[H2A])
First Equivalence Point: Amphiprotic species (HA−) present;
Second Buffer Region: HA−/A2−, pH = pKa2 + log([A2−]/[HA−])
Second Equivalence Point: Only A2− present; calculate pH using hydrolysis and .
Post-Second Equivalence: Excess OH− controls pH.
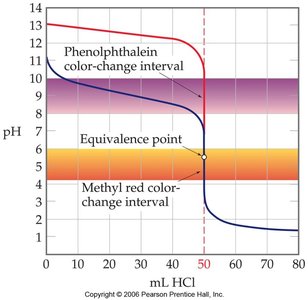
Acid-Base Indicators
Properties and Function of Acid-Base Indicators
Acid-base indicators are weak acids or bases that exhibit different colors in their acid and base forms. The color change occurs over a specific pH range, which is characteristic of each indicator. The indicator's color is determined by the relative concentrations of its acid (HIn) and base (In−) forms:
Indicator Reaction:
Color Change Range: Occurs over approximately 2 pH units, centered at the indicator's pKa ().
Choosing an Indicator: Select an indicator whose color change range matches the expected pH at the equivalence point.
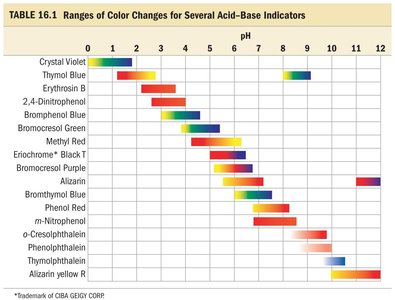
Ranges of Color Changes for Common Indicators
The table below summarizes the pH ranges over which several common acid-base indicators change color. This information is essential for selecting the appropriate indicator for a given titration.
Indicator | pH Range |
|---|---|
Crystal Violet | 0–2 |
Thymol Blue | 1–3, 8–10 |
Erythrosin B | 2–4 |
2,4-Dinitrophenol | 2–4 |
Bromophenol Blue | 3–4.5 |
Bromocresol Green | 4–5 |
Methyl Red | 4–6 |
Eriochrome Black T | 5–7 |
Bromocresol Purple | 6–7.5 |
Alizarin | 6–8 |
Bromothymol Blue | 6–8 |
Phenol Red | 6.5–8.5 |
o-Cresolphthalein | 8–10 |
Phenolphthalein | 8–10 |
Thymolphthalein | 9–11 |
Alizarin Yellow R | 10–12 |
Universal Indicators
Universal indicators are mixtures of several indicators that provide a continuous color change over a wide pH range (typically 0–14). They are useful for estimating the pH of a solution but are not suitable for precise titration endpoints.
Summary Table: Key Features of Acid-Base Titrations
Titration Type | Initial pH | Buffer Region | Equivalence Point pH | Post-Equivalence |
|---|---|---|---|---|
Strong Acid–Strong Base | Low | No | 7.00 | Excess OH− |
Weak Acid–Strong Base | Moderate | Yes | >7.00 | Excess OH− |
Weak Base–Strong Acid | High | Yes | <7.00 | Excess H3O+ |
Polyprotic Acid–Strong Base | Low | Multiple | Multiple | Excess OH− |
Additional info: The notes above integrate the main concepts, calculations, and graphical interpretations of acid-base titrations and indicators, as well as the selection of appropriate indicators for different titration types. The included images and tables reinforce the understanding of titration curves, indicator color changes, and the behavior of acids and bases during titration.
