 Back
BackAcid-Base Titrations and Indicators: Aqueous Ionic Equilibria
Study Guide - Smart Notes
 Tailored notes based on your materials, expanded with key definitions, examples, and context.
Acid-Base Titrations
Introduction to Acid-Base Titrations
Acid-base titrations are analytical techniques used to determine the concentration of an acid or base in solution by reacting it with a base or acid of known concentration. The titration process involves the gradual addition of one solution to another while monitoring the pH change, which allows for the identification of key points such as the equivalence point and buffer regions.
Strong Acid - Strong Base Titration Curves
- Initial pH: The solution starts with a low pH due to the complete ionization of the strong acid (e.g., HCl). - Equivalence Point: The pH at the equivalence point is always 7.00, as the only ions present are those from the neutral salt and water. - Post-Equivalence: After the equivalence point, the pH is determined by the excess strong base added. - No Buffer Region: There is no buffer region because neither the acid nor the base is weak. 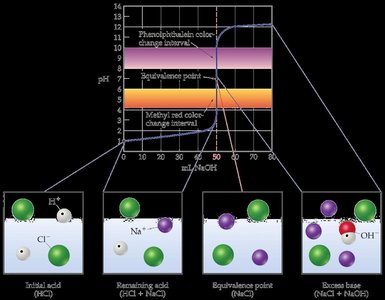
Weak Acid - Strong Base Titration Curves
- Initial pH: Higher than a strong acid due to incomplete ionization of the weak acid (e.g., acetic acid, CH3COOH). - Buffer Region: A buffer region exists where both the weak acid and its conjugate base are present. - Equivalence Point: The pH at the equivalence point is basic, as the conjugate base hydrolyzes to produce OH-. - Post-Equivalence: The pH is controlled by the excess strong base. - pH Calculations: Use the ICE table and the Henderson-Hasselbalch equation for buffer regions. 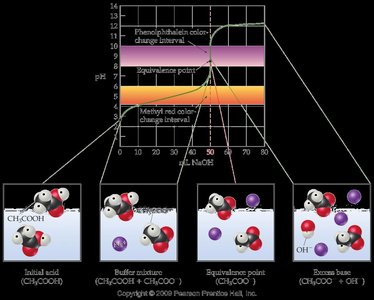
Example Calculation (Acetic Acid and NaOH)
- Initial Solution (0.00 mL NaOH): Use the weak acid equilibrium to find pH. - Halfway Point (25.00 mL NaOH): pH = pKa (buffer region). - Buffer Region (30.00 mL NaOH): Both acid and conjugate base present; use Henderson-Hasselbalch equation. - Equivalence Point (50.00 mL NaOH): All acid converted to conjugate base; treat as a weak base solution. - Post-Equivalence (55.00 mL NaOH): Excess strong base determines pH.
Generic Titration Curve Features
- Buffer Region: The region where the solution resists changes in pH upon addition of small amounts of acid or base. - Equivalence Point: The point at which stoichiometrically equivalent amounts of acid and base have reacted. - Post-Equivalence Point: The region after all the acid or base has been neutralized and excess titrant is present. 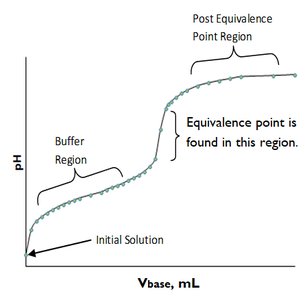
Weak Base - Strong Acid Titration Curves
- Initial pH: Lower than a strong base due to incomplete ionization of the weak base (e.g., NH3). - Buffer Region: Exists where both the weak base and its conjugate acid are present. - Equivalence Point: The pH is acidic, as the conjugate acid hydrolyzes to produce H3O+. - Post-Equivalence: Controlled by excess strong acid. 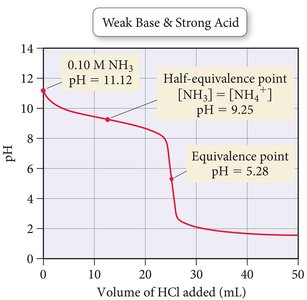
Strong Base - Strong Acid Titration Curves
- Initial pH: High due to the strong base. - Equivalence Point: pH is 7.00. - Indicator Selection: Choose an indicator whose color change interval overlaps the equivalence point. 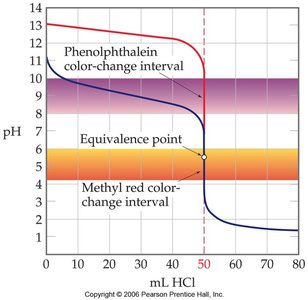
Diprotic Acid Titrations
Features of Diprotic Acid (H2A) - Strong Base Titration
- Two Equivalence Points: Each corresponds to the neutralization of one acidic proton. - Two Buffer Regions: H2A/HA- and HA-/A2-. - pH Calculations: Use the appropriate Ka or Kb for each region. - Amphiprotic Species: At the first equivalence point, the solution contains HA-, which can act as both an acid and a base.
Acid-Base Indicators
Principles of Acid-Base Indicators
Acid-base indicators are weak acids or bases that exhibit different colors in their acid (HIn) and base (In-) forms. The color observed depends on the pH of the solution and the relative concentrations of the two forms. - Indicator Reaction: - Color Change Interval: The indicator changes color over a range of approximately 2 pH units, centered around its pKa: - Indicator Selection: Choose an indicator whose color change interval matches the pH range of the equivalence point. 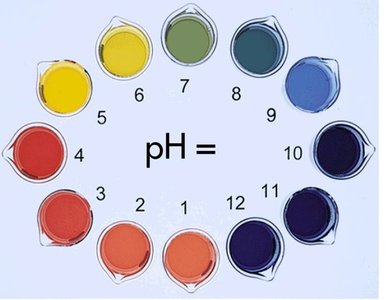
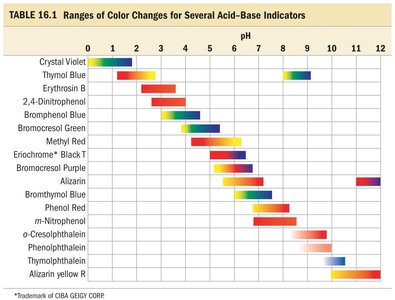
Ranges of Color Changes for Acid-Base Indicators
The table below summarizes the pH ranges over which common indicators change color.
Indicator | pH Range |
|---|---|
Crystal Violet | 0–2 |
Thymol Blue | 1–3, 8–10 |
Erythrosin B | 2–4 |
2,4-Dinitrophenol | 2–4 |
Bromophenol Blue | 3–4.5 |
Bromocresol Green | 4–5 |
Methyl Red | 4–6 |
Phenol Red | 6–8 |
Thymolphthalein | 9–11 |
Alizarin Yellow R | 10–12 |
... | ... |
Universal Indicators
- Universal Indicator: A mixture of indicators that provides a continuous color change over the entire pH range (0–14), allowing for approximate pH determination by color comparison. Example: The pH color wheel (see above) shows the range of colors for different pH values using a universal indicator.
Summary Table: Key Features of Titration Curves
Titration Type | Initial pH | Buffer Region | Equivalence Point pH | Post-Equivalence |
|---|---|---|---|---|
Strong Acid–Strong Base | Low | None | 7.00 | Excess OH- |
Weak Acid–Strong Base | Moderate | Present | Basic (>7) | Excess OH- |
Weak Base–Strong Acid | High | Present | Acidic (<7) | Excess H3O+ |
Diprotic Acid–Strong Base | Low | Two | Two points | Excess OH- |
Key Equations
Henderson-Hasselbalch Equation:
Relationship between Ka and Kb:
Percent Ionization:
Additional info:
The notes above integrate the main concepts, calculations, and graphical interpretations of acid-base titrations, buffer regions, equivalence points, and indicator selection, as covered in a typical general chemistry curriculum.
