 Back
Acid-Base Titrations and Indicators: Study Notes for General Chemistry
Study Guide - Smart Notes
 Tailored notes based on your materials, expanded with key definitions, examples, and context.
Acid-Base Titrations
Strong Acid vs. Strong Base Titrations
Acid-base titrations are fundamental analytical techniques used to determine the concentration of an acid or base in solution. When a strong acid is titrated with a strong base, both substances are completely ionized, resulting in a sharp equivalence point.
Reaction Example:
Titrant: Always a strong acid or base.
Analyte: Can be a strong or weak acid/base.
Titration Curve: Shows a rapid pH change near the equivalence point.
Detection of the End Point: Indicators
To accurately determine when the acid has completely neutralized the base, indicators are used. The equivalence point is when stoichiometric amounts of acid and base have reacted, while the end point is the observed completion of the reaction, often indicated by a color change.
Indicator: A weak acid or base that is highly colored.
Color Change: Occurs over a specific pH range, depending on the indicator's properties.
Titration Error: The difference between the equivalence point and the end point; minimized by choosing appropriate indicators.
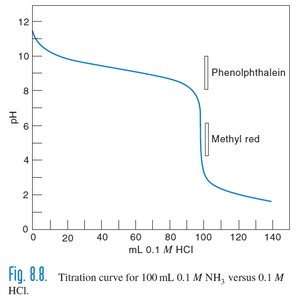
Example: Phenolphthalein and methyl red are common indicators used in titrations, each with distinct color changes at different pH ranges.
Indicator Chemistry and pH Transition Range
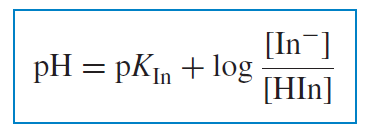
Indicators change color based on their ionization state, which is governed by the solution's pH. The Henderson–Hasselbalch equation describes the relationship between pH and the ratio of ionized to nonionized indicator forms.
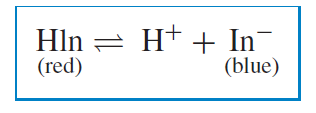
Indicator Equilibrium: (HIn: red, In-: blue)
Henderson–Hasselbalch Equation:
Transition Range: The indicator changes color from pKa − 1 to pKa + 1, typically spanning two pH units.
Color Perception: When , only the color of the nonionized form is seen; when , only the ionized form is observed.
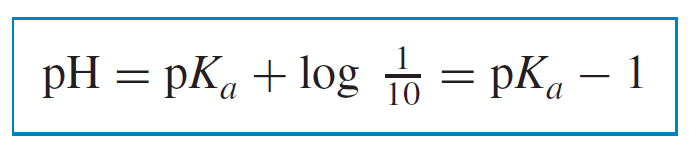

Example: The pH at which an indicator changes color is determined by its pKa. For most indicators, the transition range is about two pH units.
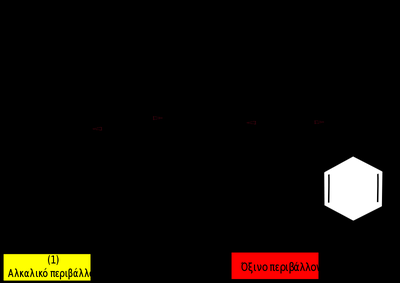
Common Acid-Base Indicators and Their pH Ranges
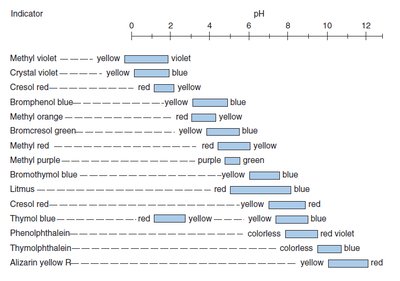
Different indicators are suitable for different titrations based on their pH transition ranges. The table below summarizes common indicators and their color changes.
Indicator | pH Range | Color Change |
|---|---|---|
Methyl violet | 0–2 | yellow → violet |
Methyl orange | 3–4 | red → yellow |
Phenolphthalein | 8–10 | colorless → red violet |
Bromothymol blue | 6–8 | yellow → blue |
Litmus | 5–8 | red → blue |
Alizarin yellow R | 10–12 | yellow → red |
Additional info: | See image for more indicators and ranges. |
Titration Curves for Weak Acids and Bases
Weak Acid vs. Strong Base
When titrating a weak acid with a strong base, the acid is only partially ionized. The titration curve is less steep near the equivalence point compared to strong acid-strong base titrations.
Example Reaction:
Buffer Region: Exists before the equivalence point, where the weak acid and its conjugate base are present.
Calculation: pH at various points can be calculated using the Henderson–Hasselbalch equation.
Weak Base vs. Strong Acid
The titration of a weak base with a strong acid is analogous to the weak acid-strong base case, but the curve is reversed. The base is only partially ionized, and the equivalence point occurs at a pH less than 7.
Example Reaction:
Titration Curve: Shows a gradual decrease in pH, with a buffer region before the equivalence point.
Equations Governing Weak Acid/Base Titrations
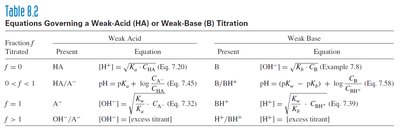
The following table summarizes the equations used to calculate pH at different stages of a weak acid or weak base titration.
Fraction Titrated | Weak Acid Present | Equation | Weak Base Present | Equation |
|---|---|---|---|---|
f = 0 | HA | B | ||
0 < f < 1 | HA/A- | B/BH+ | ||
f = 1 | A- | BH+ | ||
f > 1 | OH-/A- | H+/BH+ |
Titration of Polyprotic Acids and Diprotic Bases
Titration of Sodium Carbonate (Diprotic Base)
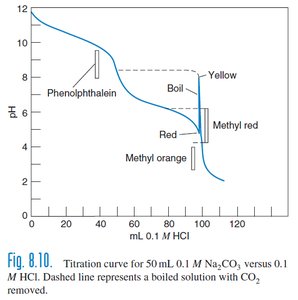
Sodium carbonate (Na2CO3) is a diprotic base that can be titrated in two steps, corresponding to the sequential addition of protons. The titration curve shows two distinct equivalence points.
Stepwise Hydrolysis:
End Points: Phenolphthalein and methyl orange are used to detect the two equivalence points.
Carbonic Acid: Dissociates to CO2 and H2O in acid solution.

Titration of Polyprotic Acids
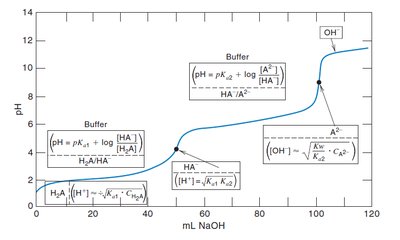
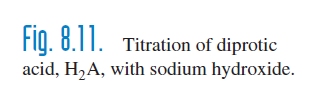
Diprotic and triprotic acids can be titrated stepwise, with each proton being neutralized in sequence. The ability to observe distinct end points depends on the difference in acid dissociation constants (Ka values).
Diprotic Acids: Good end-point breaks for the first proton if Ka1 is at least 104 × Ka2.
Triprotic Acids: Third proton often too weak (Ka3 too small) for a clear end point.
Mixtures of Acids or Bases
Stepwise Titration of Mixtures
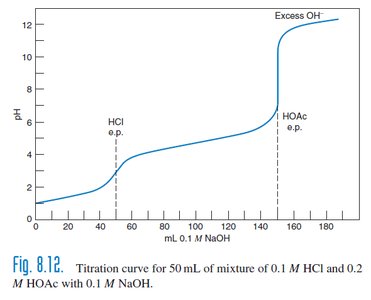
Mixtures of acids or bases can be titrated stepwise if there is a significant difference in their strengths. Separate end points are observed for each component, provided their Ka values differ by at least 104.
Strong vs. Weak Acid: Separate end point for weak acid only if Ka is about 10-5 or smaller.
Example: Titration of a mixture of HCl and H3PO4 with NaOH shows two distinct equivalence points.
Calculation: Millimoles of each acid/base can be determined from the volume of titrant required to reach each end point.
Example: Sodium hydroxide and sodium carbonate titrated together with HCl will show two end points, corresponding to the neutralization of OH- and CO32-.
Buffer Solutions in Titrations
Buffer Preparation and pH Calculation
Buffer solutions are prepared by mixing a weak acid with its conjugate base or a weak base with its conjugate acid. The pH of the buffer can be calculated using the Henderson–Hasselbalch equation.
Example: Adding 20 mL of 0.10 M NaOH to 50 mL of 0.10 M acetic acid forms a buffer.
Equation:
Additional info: Buffer regions are visible in titration curves, where pH changes slowly despite addition of titrant.
----------------------------------------
