 Back
BackAcid-Base Titrations I: pH Curves and Strong Acid–Strong Base Reactions
Study Guide - Smart Notes
 Tailored notes based on your materials, expanded with key definitions, examples, and context.
Acid-Base Titrations
Introduction to Titrations
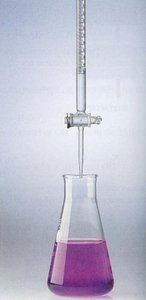
Titration is a quantitative analytical technique used to determine the concentration of an unknown solution (analyte) by reacting it with a solution of known concentration (titrant). In acid-base titrations, a base is typically added to an acid (or vice versa) until the reaction reaches completion, which is indicated by a measurable change such as a color shift or pH change.
Titrant: Solution of known concentration, added from a burette.
Analyte: Solution of unknown concentration, present in a known volume.
Aim: To determine the concentration of the analyte by stoichiometric reaction with the titrant.

Key Concepts in Titration
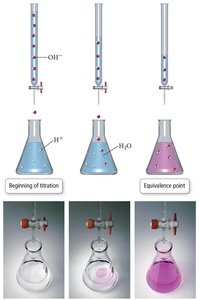
Equivalence Point: The stage in the titration when the number of moles of titrant added is stoichiometrically equal to the number of moles of analyte present. For strong acid–strong base titrations, this is when all the acid has been neutralized by the base (or vice versa).
End Point: The point at which the indicator changes color, signaling that the titration is complete. The end point should be as close as possible to the equivalence point.
The neutralization reaction for a strong acid (HCl) and a strong base (NaOH) is:
At the equivalence point:
General titration equation:
Titration Curves
Strong Acid–Strong Base Titration Curve
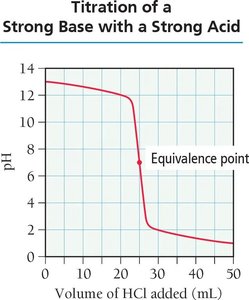
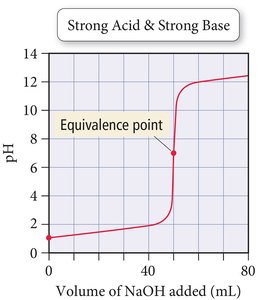
A titration curve plots the pH of the solution as a function of the volume of titrant added. For a strong acid–strong base titration, the curve shows a rapid pH change near the equivalence point.
Before equivalence point: Solution is acidic; pH increases gradually as base is added.
At equivalence point: Solution is neutral; pH = 7.00 at 25°C.
After equivalence point: Solution is basic; pH increases sharply as excess base is added.

Strong Base–Strong Acid Titration Curve
When a strong base is titrated with a strong acid, the curve is similar but starts at a high pH and decreases as acid is added.
Monitoring pH During Titration
pH Meter and Indicators
The progress of a titration can be monitored using a pH meter or a chemical indicator. A pH meter provides a continuous, quantitative measurement of pH, while indicators provide a visual signal (color change) at or near the equivalence point.
pH Meter: Measures the pH directly and allows for the construction of a titration curve.
Indicator: A weak acid or base that changes color at a specific pH range. The choice of indicator depends on the expected pH at the equivalence point.

Choosing the Right Indicator
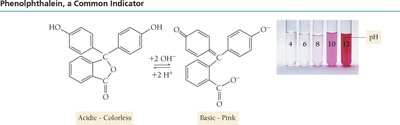
The indicator should have a color change range that brackets the pH at the equivalence point. For strong acid–strong base titrations, phenolphthalein (colorless in acid, pink in base) is commonly used.
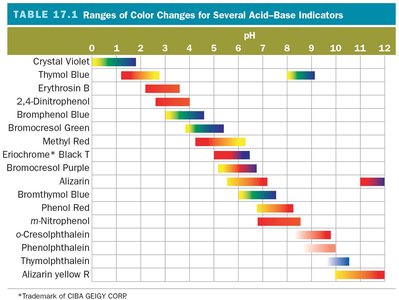
Ranges of Color Changes for Acid-Base Indicators
Different indicators change color at different pH ranges. The table below summarizes the color change ranges for several common indicators:
Indicator | pH Range |
|---|---|
Phenolphthalein | 8.2 – 10.0 |
Methyl Red | 4.2 – 6.3 |
Bromothymol Blue | 6.0 – 7.6 |
Thymol Blue | 1.2 – 2.8, 8.0 – 9.6 |
Crystal Violet | 0.0 – 2.0 |
Calculation Steps for Strong Acid–Strong Base Titrations
Stepwise Calculation Along the Titration Curve
Calculating the pH at various points during a titration involves different approaches depending on the stage:
Initial (Before any base is added): Only strong acid is present. Calculate pH as for a strong acid solution:
Before Equivalence Point: Acid is in excess. Calculate the excess moles of acid, determine the new concentration, and find pH:
At Equivalence Point: Moles of acid = moles of base. The solution contains only water and the salt of a strong acid and strong base, so pH = 7.00 at 25°C.
After Equivalence Point: Base is in excess. Calculate the excess moles of base, determine the new concentration, and find pOH and pH:
Example Calculation
Suppose 100.0 mL of 0.500 M HCl is titrated with 60.0 mL of 1.00 M NaOH. Calculate the pH of the solution after addition of NaOH.
Identify the reaction:
Calculate moles:
Determine excess reagent: NaOH is in excess by mol.
Calculate [OH−]:
Convert to pH:
Summary Table: Titration Curve Regions and Calculations
Region | Situation | Calculation |
|---|---|---|
Initial | Only strong acid present | |
Before Equivalence | Acid in excess | (from excess acid) |
Equivalence Point | Acid = Base | |
After Equivalence | Base in excess | , |
