 Back
BackAcid-Base Titrations: Weak Bases, Polyprotic Acids, and Titration Curves
Study Guide - Smart Notes
 Tailored notes based on your materials, expanded with key definitions, examples, and context.
Acid-Base Titrations
Introduction to Acid-Base Titrations
Acid-base titrations are quantitative experiments used to determine the concentration of an acid or base by reacting it with a base or acid of known concentration. The titration curve, which plots pH versus the volume of titrant added, provides valuable information about the acid-base properties of the analyte and the titrant.
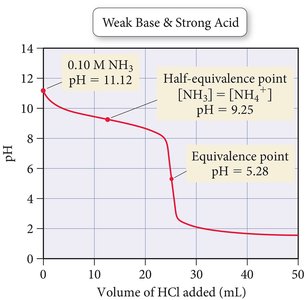
Titration of a Weak Base with a Strong Acid
Key Concepts and Regions of the Titration Curve
Initial Point: Only the weak base is present; no acid has been added. The pH is calculated as for a weak base solution using an ICE table and the base dissociation constant (Kb).
Before Equivalence Point: The moles of base exceed the moles of acid. The solution contains a mixture of the weak base and its conjugate acid, forming a buffer. The pH is calculated using the Henderson-Hasselbalch equation for bases:
Half-Equivalence Point: Half of the weak base has been converted to its conjugate acid. At this point, , so and .
Equivalence Point: The moles of acid added equal the moles of base present. All the weak base is converted to its conjugate acid, which is a weak acid. The pH is calculated using the Ka of the conjugate acid () and an ICE table.
After Equivalence Point: Excess strong acid is present. The pH is determined by the concentration of excess ions:
Buffer Region and Henderson-Hasselbalch Equation
Buffer Formation During Titration
During the titration of a weak base with a strong acid, a buffer solution forms before the equivalence point. The buffer consists of the weak base and its conjugate acid. The pH in this region is resistant to changes upon addition of small amounts of acid or base and is calculated using the Henderson-Hasselbalch equation.
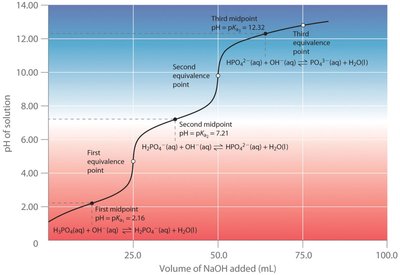
Titration of Polyprotic Acids
Stepwise Ionization and Multiple Equivalence Points
Polyprotic acids, such as phosphoric acid (), can donate more than one proton in a stepwise manner. Each ionization step has its own value and equivalence point. The titration curve for a polyprotic acid shows multiple buffer regions and equivalence points, corresponding to the sequential loss of protons.
First Ionization: ()
Second Ionization: ()
Third Ionization: ()
Each equivalence point corresponds to the complete neutralization of one acidic proton. The pH at each midpoint (half-equivalence point) equals the pKa for that ionization step.
Summary Table: Titration Regions and Calculations
The following table summarizes the main regions of a titration curve and the calculation methods for each:
Region/Pt of Titration Curve | Situation | Calculation Method |
|---|---|---|
Initial | No titrant; only analyte present | Weak acid/base equilibrium (ICE table) |
Before Equivalence Point | Moles analyte > moles titrant | Buffer calculation (Henderson-Hasselbalch) |
Equivalence Point | Moles analyte = moles titrant | Conjugate acid/base equilibrium (ICE table) |
After Equivalence Point | Moles titrant > moles analyte | Excess strong acid/base calculation |
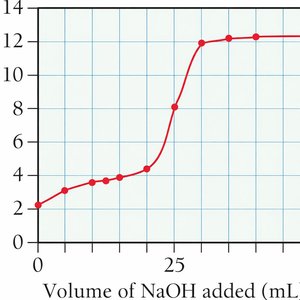
Practice Example: Titration Curve of a Weak Acid with a Strong Base
Example Problem
A student titrates 25.00 mL of 0.500 M propanoic acid () with 1.005 M NaOH. The of propanoic acid is . The titration curve shows the pH at various volumes of NaOH added, illustrating the buffer region, equivalence point, and post-equivalence region.
Concept Maps for Titration Types
Classification of Titrations
Titrations can be classified based on the strength of the acid and base involved. The titration curve and calculation methods differ for each type:
Strong Acid - Strong Base: Sharp equivalence point at pH 7. Calculations involve direct stoichiometry and strong acid/base equilibrium.
Weak Acid - Strong Base: Buffer region before equivalence, equivalence point above pH 7.
Weak Base - Strong Acid: Buffer region before equivalence, equivalence point below pH 7.

Summary of Key Equations
Henderson-Hasselbalch Equation (Base):
Relationship between and :
pH and pOH Relationship:
pH from :
Lab Techniques: Titration Apparatus
Using a Buret and Erlenmeyer Flask
In titration experiments, a buret is used to deliver the titrant to the analyte solution in an Erlenmeyer flask. The endpoint is detected using an indicator or a pH meter.

Additional info:
ICE tables (Initial, Change, Equilibrium) are essential for calculating concentrations at various points in the titration, especially for weak acids and bases.
Buffer capacity is highest at the half-equivalence point, where the concentrations of the weak acid/base and its conjugate are equal.
