 Back
BackAP Chemistry Study Guide: Chemical Kinetics and Rate Laws (Topics 5.1–5.3)
Study Guide - Smart Notes
 Tailored notes based on your materials, expanded with key definitions, examples, and context.
Chemical Kinetics
Introduction to Reaction Rates
Chemical kinetics is the study of the speed at which chemical reactions occur and the factors that affect these rates. The rate of a reaction is typically expressed as the change in concentration of a reactant or product per unit time, often in units such as M/s (molarity per second).
Reaction Rate: The rate at which reactants are converted to products.
Units: Commonly M/s, M/min, etc.
Initial Rate: The fastest rate, measured at time = zero when reactant concentrations are highest.
Example: If the concentration of N2O5 decreases from 5.70 M to 4.30 M in 100 s, the change is 1.40 M.
Factors Affecting Reaction Rate
Several factors influence the rate of a chemical reaction:
Concentration: Higher concentration increases collision frequency, leading to a faster reaction.
Temperature: Higher temperature increases collision energy and frequency, speeding up the reaction.
Surface Area: Greater surface area (e.g., metal powder vs. metal strip) increases collision opportunities.
Rate Laws and Reaction Order
Defining Rate Laws
The rate law expresses the relationship between the reaction rate and the concentrations of reactants. It is determined experimentally and is not necessarily related to the stoichiometric coefficients in the balanced equation.
General Form:
Rate Constant (k): A proportionality constant determined from experimental data.
Reaction Order: The exponent for each reactant in the rate law; overall order is the sum of exponents.
Example: If doubling [NO] quadruples the rate, the reaction is second order with respect to NO.
Determining Reaction Order
Reaction order is found by analyzing how changes in reactant concentration affect the reaction rate.
First Order: Doubling concentration doubles the rate.
Second Order: Doubling concentration quadruples the rate.
Zero Order: Rate is independent of concentration.
Example: If tripling [ClO2] increases rate by 9, the reaction is second order with respect to ClO2.
Units of Rate Constant (k)
The units of the rate constant depend on the overall order of the reaction:
Zero Order: ; units: M/s
First Order: ; units: s–1
Second Order: or ; units: M–1 s–1
Third Order: ; units: M–2 s–1
Graphical Analysis of Reaction Order
Identifying Reaction Order from Graphs
Different reaction orders produce characteristic graphs when concentration or its transformations are plotted against time:
Zero Order: [A] vs. time is linear.
First Order: ln[A] vs. time is linear.
Second Order: 1/[A] vs. time is linear.
Half-Life and First Order Reactions
For first order reactions, the half-life (time for concentration to halve) remains constant regardless of initial concentration.
Half-Life Formula:
Example: If the half-life is 10 hours, every 10 hours the concentration halves.
Integrated Rate Laws
First Order Integrated Rate Law
The integrated rate law for a first order reaction relates concentration to time:
Formula:
Example Calculation: If , then .
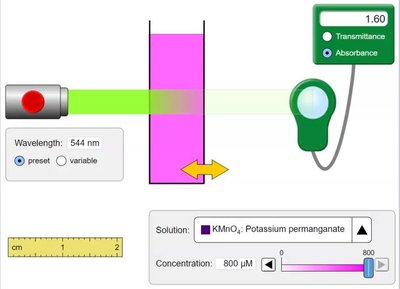
Beer-Lambert Law (Topic 3.13)
Absorbance and Concentration
The Beer-Lambert Law relates the absorbance of a solution to its concentration, path length, and molar absorptivity:
Formula:
Absorbance (A): Directly proportional to concentration (c).
Application: Used in spectrophotometry to determine concentration of colored solutions.
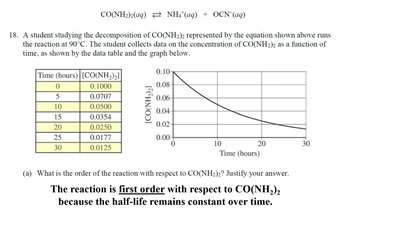
Worked Example: Decomposition of Urea
Experimental Data and Graphical Analysis
A student studies the decomposition of urea, CO(NH2)2, and collects concentration data over time. The reaction is first order because the half-life remains constant and the plot of ln[CO(NH2)2] vs. time is linear.
Data Table:
Time (hours) | [CO(NH2)2] |
|---|---|
0 | 0.1000 |
5 | 0.0707 |
10 | 0.0500 |
15 | 0.0354 |
20 | 0.0250 |
25 | 0.0177 |
30 | 0.0125 |
Graph: [CO(NH2)2] vs. time shows exponential decay; ln[CO(NH2)2] vs. time is linear.
Conclusion: The reaction is first order with respect to urea.
Summary Table: Reaction Orders and Graphs
Order | Graph (Linear) | Integrated Rate Law | Units of k |
|---|---|---|---|
Zero | [A] vs. time | M/s | |
First | ln[A] vs. time | s–1 | |
Second | 1/[A] vs. time | M–1 s–1 |
Key Takeaways
Reaction rates depend on concentration, temperature, and surface area.
Rate laws must be determined experimentally.
Graphical analysis helps identify reaction order.
Beer-Lambert Law is used to relate absorbance to concentration in spectrophotometry.
