 Back
BackAqueous Ionic Equilibria: Buffers and Acid-Base Titrations
Study Guide - Smart Notes
 Tailored notes based on your materials, expanded with key definitions, examples, and context.
Buffer Solutions
Definition, Components, and Properties
Buffer solutions are mixtures that resist changes in pH when small amounts of strong acid or base are added. They consist of a weak acid and its conjugate base, or a weak base and its conjugate acid.
Components: Typically, a weak acid (HA) and its salt (A−), or a weak base (B) and its salt (BH+).
Properties: Buffers maintain pH stability, crucial in biological and chemical systems.
Example: Acetic acid (HC2H3O2) and sodium acetate (NaC2H3O2).
Understanding Buffer Action
Buffer action relies on the equilibrium between the weak acid and its conjugate base. When strong acid is added, the base component neutralizes it; when strong base is added, the acid component neutralizes it.
Le Chatelier's Principle: Addition of acid or base shifts the equilibrium, minimizing pH change.
Henderson-Hasselbalch Equation and pH Calculation
The Henderson-Hasselbalch equation relates the pH of a buffer to the concentrations of its acid and base components:
Equation:
Application: Used to calculate buffer pH and to design buffer solutions with desired pH values.
Preparation of Buffer Solutions
Preparation from Available Chemicals and Solutions
To prepare a buffer, select a weak acid/base with a pKa close to the desired pH, then mix appropriate amounts of acid and conjugate base.
Example: Preparing 500 mL of pH 4.25 buffer from 1.00 M acetic acid and solid sodium acetate:
Calculate the required ratio using Henderson-Hasselbalch:
Determine mass of sodium acetate needed:
Dissolve in acetic acid, dilute to volume, and adjust pH as needed.
Buffer Capacity and Range
Buffer Capacity
Buffer capacity measures the ability of a buffer to resist pH changes upon addition of strong acid or base.
Quantitative Definition: Number of moles of strong acid/base causing 1 L of buffer to change pH by 1 unit.
Dependence: Higher concentrations of buffer components increase capacity.
Maximum Capacity: When [A−]/[HA] = 1, i.e., pH = pKa.
Buffer Range
The useful pH range of a buffer is pKa ± 1. Outside this range, the buffer loses effectiveness.
Lower Limit:
Upper Limit:
Best:
Calculations Involving Buffers Using the ICE Table
ICE Table Method
The ICE (Initial, Change, Equilibrium) table is used to calculate equilibrium concentrations and pH in buffer solutions.
Example: Buffer with 0.30 M acetic acid and 0.20 M sodium acetate:
Set up equilibrium:
Calculate pH using ICE table and Henderson-Hasselbalch equation:
Common Ion Effect
The presence of a common ion suppresses ionization, reducing % ionization compared to a solution containing only the weak acid.
Example: % ionization in buffer is 0.009%, compared to 0.77% in pure acetic acid solution.
Buffer Response to Strong Acid/Base Addition
When strong acid or base is added, the buffer components react to minimize pH change.
Strong Base Addition: OH− reacts with acid component.
Strong Acid Addition: H+ reacts with base component.
Use Henderson-Hasselbalch equation to recalculate pH after addition.
Acid-Base Titrations
Terminology and Concepts
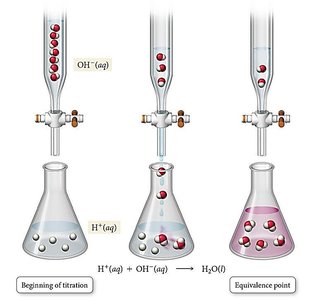
Acid-base titrations involve the gradual addition of a titrant to an analyte to determine concentration or other properties.
Titrant: Solution of known concentration added from a buret.
Analyte: Solution of unknown concentration in the flask.
Equivalence Point: Stoichiometric amount of titrant added; theoretical completion.
Endpoint: Detected by indicator color change; may differ slightly from equivalence point.
Titration Error: Difference between endpoint and equivalence point.
Acid-Base Titration Curves
During titration, pH changes are monitored and plotted as a titration curve (pH vs. volume of titrant).
Information from Curve: Equivalence point, unknown concentration, dissociation constants (Ka, Kb), and molecular weight.
Categories: Strong acid-strong base, weak acid-strong base, weak base-strong acid, polyprotic acid-strong base.
Strong Acid - Strong Base Titration Curve
Example: Titrating 50.00 mL of 0.10 M HCl with 0.10 M NaOH.
Reaction:
Key Points:
0.00 mL NaOH: Initial solution, pH = 1.00
25.00 mL NaOH: Halfway, pH = 1.48
50.00 mL NaOH: Equivalence point, pH = 7.00
55.00 mL NaOH: Post-equivalence, pH = 11.68
Summary Table: Buffer Capacity and Range
Buffer Ratio | pH | Buffer Effectiveness |
|---|---|---|
1:10 (Base:Acid) | pKa - 1 | Lower limit |
10:1 (Base:Acid) | pKa + 1 | Upper limit |
1:1 (Base:Acid) | pKa | Maximum capacity |
Summary Table: Strong Acid-Strong Base Titration Regions
Volume NaOH (mL) | Region | Description | Anticipated pH |
|---|---|---|---|
0.00 | Initial | Strong acid solution | Acidic |
25.00 | Halfway | Half acid consumed | Acidic |
50.00 | Equivalence | All acid consumed | Neutral |
55.00 | Post-equivalence | Excess base | Basic |
