 Back
BackChapter 7A Study Guide
Study Guide - Smart Notes
 Tailored notes based on your materials, expanded with key definitions, examples, and context.
Buffer Solutions and the Common Ion Effect
Definition and Formation of Buffers
Buffer solutions are mixtures that resist changes in pH when small amounts of acid or base are added. This resistance is due to the common ion effect, which occurs when the same ion is produced by two different compounds in solution. Buffers are typically formed by:
A weak acid and a soluble salt of its conjugate base (e.g., acetic acid and sodium acetate).
A weak base and a soluble salt of its conjugate acid (e.g., ammonia and ammonium chloride).
Key Point: Buffers maintain pH stability, which is crucial in many chemical and biological processes. Example: A solution of 0.15 M acetic acid and 0.15 M sodium acetate forms a buffer.
Buffer Calculations and the Henderson-Hasselbalch Equation
The ionization of a weak acid can be represented as:
The ionization constant expression is:
Solving for and applying algebra yields the Henderson-Hasselbalch equation:
Key Point: This equation allows calculation of buffer pH given the concentrations of acid and salt.
Buffer Solutions with Weak Bases
Buffers can also be made from a weak base and its salt. The ionization of a weak base is:
The analogous Henderson-Hasselbalch equation for bases is:
Example: A solution of 0.15 M ammonia and 0.30 M ammonium nitrate forms a buffer.
Acid-Base Indicators
Indicator Function and Color Change
Acid-base indicators are substances that change color depending on the pH of the solution. The equivalence point is when chemically equivalent amounts of acid and base have reacted, while the end point is when the indicator changes color. The equilibrium for an indicator is:
Key Point: The color change occurs over a specific pH range, unique to each indicator.
Table: Acid-Base Indicator Color Ranges
Indicator | Color in Acidic Range | pH Range | Color in Basic Range |
|---|---|---|---|
Methyl violet | Yellow | 0 - 2 | Purple |
Methyl orange | Pink | 3.1 – 4.4 | Yellow |
Litmus | Red | 4.7 – 8.2 | Blue |
Phenolphthalein | Colorless | 8.3 – 10.0 | Red |
Titration Curves
Strong Acid/Strong Base Titration Curves
Titration curves plot pH versus the volume of titrant added. For strong acid/strong base titrations, the curve shows a sharp rise in pH at the equivalence point, which is typically at pH 7. Example: Titration of 0.100 M perchloric acid with 0.100 M potassium hydroxide. 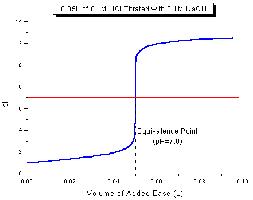
Weak Acid/Strong Base Titration Curves
When a weak acid is titrated with a strong base, the curve rises more gradually, and the equivalence point is above pH 7 due to the production of a weak conjugate base. Example: Titration of 0.100 M acetic acid with 0.100 M NaOH. 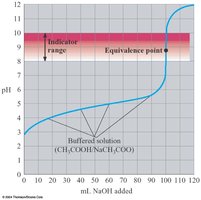
Strong Acid/Weak Base and Weak Acid/Weak Base Titration Curves
Strong acid/weak base titration curves are similar to weak acid/strong base curves but inverted.
Weak acid/weak base titration curves have short vertical sections and are buffered before and after the equivalence point. Visual indicators are not suitable for these titrations.
Summary Table: Buffer and Titration Key Points
Buffer Type | Components | pH Calculation |
|---|---|---|
Acidic Buffer | Weak acid + salt of conjugate base | |
Basic Buffer | Weak base + salt of conjugate acid |
Applications and Examples
Buffer solutions are used in maintaining pH in biological systems, industrial processes, and analytical chemistry.
Titration curves help identify equivalence points and select appropriate indicators for acid-base titrations.
Additional info: The notes include worked examples and study questions for practice, reinforcing the concepts of buffer calculations, indicator selection, and titration analysis.
