 Back
BackAqueous Ionic Equilibrium: Buffers, Titrations, and Solubility
Study Guide - Smart Notes
 Tailored notes based on your materials, expanded with key definitions, examples, and context.
Chapter 18: Aqueous Ionic Equilibrium
Buffer Solutions
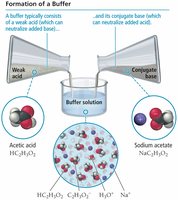
Buffer solutions are essential in chemistry and biology for maintaining a stable pH, even when acids or bases are added. A buffer typically consists of a significant amount of a weak acid and its conjugate base, or a weak base and its conjugate acid.
Definition: A buffer resists changes in pH by neutralizing added acid or base.
Components: Must contain both a weak acid and its conjugate base, or a weak base and its conjugate acid.
Example: Blood pH is maintained at 7.35–7.45 using the carbonic acid (H2CO3)/bicarbonate (HCO3-) buffer system.
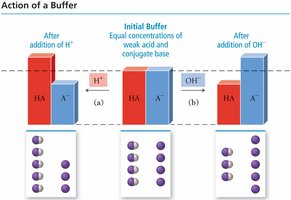
How Buffers Work
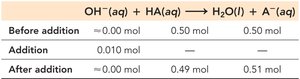
Buffers react with added acids or bases to minimize pH changes, following Le Châtelier’s principle. The weak acid neutralizes added base, while the conjugate base neutralizes added acid.
Acid Addition: The conjugate base reacts with added acid to form more weak acid.
Base Addition: The weak acid reacts with added base to form more conjugate base.
Buffer Examples and pH Measurement
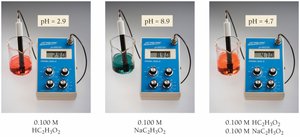
Different combinations of weak acids/bases and their conjugates result in different pH values. For example, acetic acid and sodium acetate form a buffer with a pH near 4.7.
Acetic Acid (HC2H3O2): Weak acid
Sodium Acetate (NaC2H3O2): Conjugate base
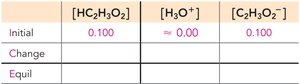
Calculating Buffer pH
The pH of a buffer can be calculated using equilibrium analysis or the Henderson-Hasselbalch equation. The common ion effect occurs when a salt containing a buffer ion is added, shifting equilibrium and reducing solubility.
Henderson-Hasselbalch Equation:
Equilibrium Approach: Use ICE tables to solve for pH when initial concentrations and are known.
Common Ion Effect: Adding a salt with a common ion reduces the solubility of the weak acid/base.
Buffer Capacity and Range
Buffer capacity is the amount of acid or base a buffer can neutralize before pH changes significantly. Buffer range is the pH range over which the buffer is effective, typically within ±1 pH unit of the pKa of the acid.
Capacity: Greatest when [acid] ≈ [base]
Range: Effective when ratio of [acid] to [base] is between 0.1 and 10
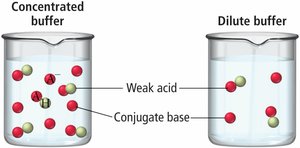
Buffer Effectiveness: Relative and Absolute Concentrations
The effectiveness of a buffer depends on both the relative and absolute concentrations of its components. Higher concentrations provide greater capacity, while the ratio determines the pH.
Relative Amounts: Equal amounts of acid and base yield pH = pKa.
Absolute Concentrations: More concentrated buffers resist pH changes better.
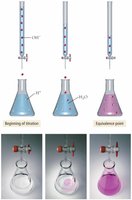
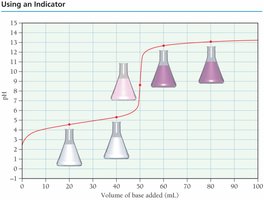
Titrations and Titration Curves
Titration is a technique for determining the concentration of an unknown solution by reacting it with a solution of known concentration. The equivalence point is when stoichiometric amounts of acid and base have reacted.
Indicator: Used to signal the endpoint of titration by color change.
Titration Curve: Plot of pH vs. volume of titrant added, showing the equivalence point as an inflection.
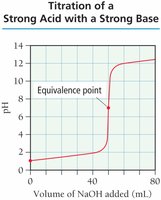
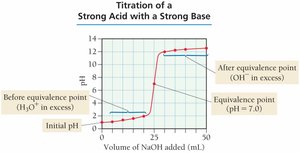
Strong Acid-Strong Base Titration
When titrating a strong acid with a strong base, the pH rises sharply at the equivalence point, which is typically at pH 7.
Initial pH: Determined by the strong acid.
Equivalence Point: All acid neutralized; pH = 7.
After Equivalence: Excess base determines pH.
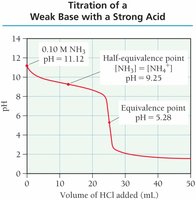
Weak Acid-Strong Base Titration
Titrating a weak acid with a strong base produces a buffer region before the equivalence point, and the equivalence point pH is above 7 due to the formation of a weak conjugate base.
Buffer Region: pH changes gradually as acid and conjugate base are present.
Equivalence Point: pH > 7 due to weak conjugate base.
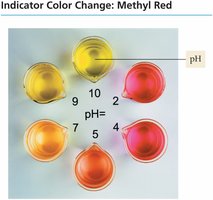
Indicators and pH Monitoring
Indicators are substances that change color at specific pH values, allowing for visual monitoring of titrations. The color change corresponds to the transition between the acid and base forms of the indicator.
Phenolphthalein: Colorless in acid, pink in base.
Methyl Red: Red in acid, yellow in base.
Indicator Range: Each indicator has a specific pH range for color change.
Solubility Equilibria
Solubility equilibria describe the dissolution of ionic compounds in water. The solubility product constant () quantifies the equilibrium between a solid and its ions in solution.
Solubility: Amount of solute that dissolves in a given solvent at a specific temperature.
Molar Solubility: Moles of solute per liter of solution.
Solubility Product ():
Common Ion Effect and Solubility
The solubility of an ionic compound decreases in the presence of a common ion, due to Le Châtelier’s principle. This effect is important in controlling precipitation and dissolution in various chemical processes.
Example: CaF2 is less soluble in NaF solution due to the common F- ion.
Precipitation and Selective Precipitation
Precipitation occurs when the product of ion concentrations exceeds . Selective precipitation is used to separate ions based on their differing solubilities.
Q vs. : Q = (saturated, no precipitate); Q < $K_{sp}$ (unsaturated, no precipitate); Q > $K_{sp}$ (supersaturated, precipitate forms).
Selective Precipitation: Used in qualitative analysis to separate ions.
Qualitative Chemical Analysis
Qualitative analysis uses selective precipitation to identify ions in a sample. Different groups of ions are separated based on their solubility in various reagents.
Group 1: Insoluble chlorides (Ag+, Pb2+, Hg22+)
Group 2: Acid-insoluble sulfides (Cu2+, Bi3+, etc.)
Group 3: Base-insoluble sulfides and hydroxides (Fe2+, Zn2+, etc.)
Group 4: Insoluble phosphates (Mg2+, Ca2+, Ba2+)
Group 5: Soluble ions (Na+, K+, NH4+)
Complex Ion Equilibria
Transition metals often form complex ions with ligands, increasing their solubility in water. The formation constant () describes the equilibrium for complex ion formation.
Ligands: Molecules or ions that donate electron pairs to the metal ion.
Complex Ion: A metal ion surrounded by ligands.
Formation Constant ():
Solubility of Amphoteric Metal Hydroxides
Some metal hydroxides are amphoteric, meaning they can dissolve in both acidic and basic solutions. Examples include Al(OH)3, Cr(OH)3, Zn(OH)2, Pb(OH)2, and Sn(OH)2.
Acidic Solution: Increases solubility by protonating the hydroxide.
Basic Solution: Increases solubility by forming complex ions.
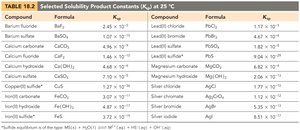
Summary Table: Solubility Product Constants
The following table summarizes selected solubility product constants () for common ionic compounds at 25°C:
Compound | Formula | |
|---|---|---|
Barium sulfate | BaSO4 | 1.1 × 10⁻¹⁰ |
Calcium carbonate | CaCO3 | 4.8 × 10⁻⁹ |
Silver chloride | AgCl | 1.8 × 10⁻¹⁰ |
Magnesium hydroxide | Mg(OH)2 | 2.06 × 10⁻¹³ |
Lead(II) bromide | PbBr2 | 4.9 × 10⁻⁵ |
Iron(II) sulfide | FeS | 6.3 × 10⁻¹⁸ |
Silver bromide | AgBr | 5.0 × 10⁻¹³ |
Silver iodide | AgI | 8.5 × 10⁻¹⁷ |
Additional info: The notes above expand on the original content, providing definitions, examples, equations, and context for each topic. Images included are directly relevant to the explanations and reinforce key concepts.
