 Back
Aqueous Ionic Equilibrium: Buffers, Titrations, Solubility, and Complex Ions
Study Guide - Smart Notes
 Tailored notes based on your materials, expanded with key definitions, examples, and context.
Buffers
Definition and Function
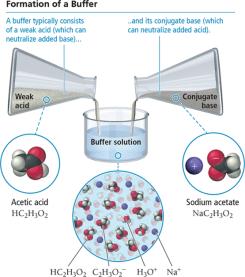
A buffer is a solution that resists changes in pH when small amounts of acid or base are added. Buffers typically consist of a weak acid and its conjugate base, or a weak base and its conjugate acid. The presence of both components allows the buffer to neutralize added H+ or OH− ions, maintaining a relatively stable pH.
Weak Acid (HA): Neutralizes added base (OH−).
Conjugate Base (A−): Neutralizes added acid (H+).
Example: Acetic acid (HC2H3O2) and sodium acetate (NaC2H3O2).
Buffer Action Mechanism
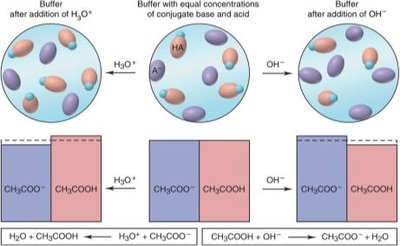
When a strong acid or base is added to a buffer, the buffer components react to minimize pH change:
Add strong base: HA + OH− → A− + H2O
Add strong acid: A− + H+ → HA + H2O
If the amount of added acid/base is small relative to the buffer components, the pH change is minimal.
Buffer Capacity and Range
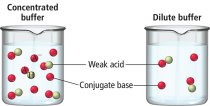
Buffer capacity is the amount of acid or base a buffer can neutralize before the pH changes significantly. It depends on the concentrations of the buffer components. The buffer range is the pH interval over which the buffer is effective, typically when the ratio of acid to base is between 1:10 and 10:1.
Best buffer capacity: High concentrations of both components and similar amounts of acid and base.
Calculating Buffer pH
Henderson-Hasselbalch Equation
The Henderson-Hasselbalch equation relates the pH of a buffer to the concentrations of its acid and conjugate base:
For a weak acid buffer:
For a weak base buffer:
When pH = pKa, the concentrations of acid and base are equal.
Titrations and pH Curves
Acid-Base Titration Overview
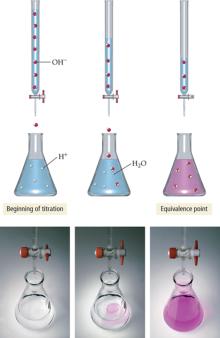
Titration is a technique used to determine the concentration of an unknown solution by reacting it with a solution of known concentration (titrant). The equivalence point is reached when stoichiometric amounts of acid and base have reacted. The endpoint is indicated by a color change from an indicator.
Titration Curves
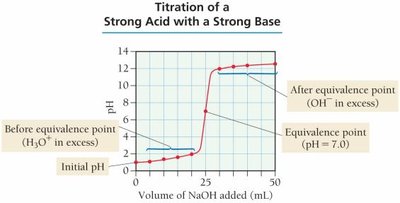
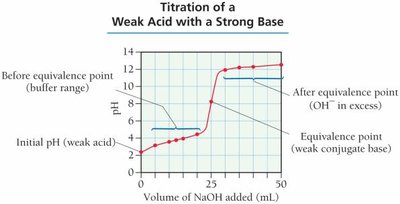
Titration curves plot pH as a function of titrant volume added. The shape of the curve depends on the strength of the acid and base involved.
Strong Acid + Strong Base: Sharp rise in pH at equivalence point (pH = 7).
Weak Acid + Strong Base: Initial pH is higher, buffer region before equivalence, equivalence point pH > 7.
Indicators
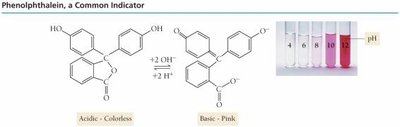
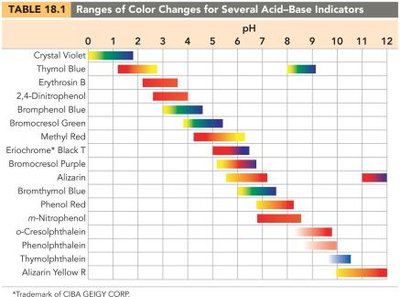
Indicators are substances that change color at specific pH values, helping to identify the endpoint of a titration. Phenolphthalein is a common indicator, colorless in acidic solutions and pink in basic solutions.
Solubility Equilibria
Solubility Product Constant (Ksp)
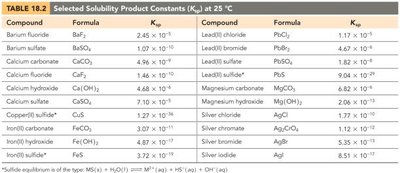
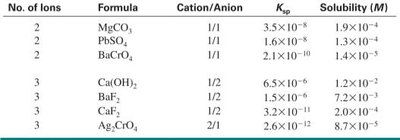
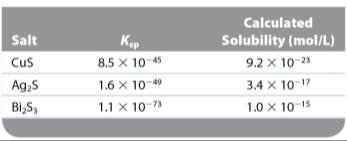
The solubility product constant (Ksp) describes the equilibrium between a solid and its ions in a saturated solution. For a salt AB:
Common Ion Effect
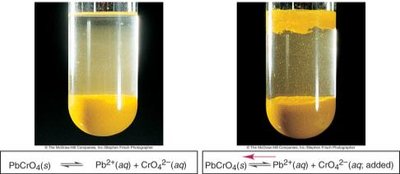
The common ion effect occurs when a salt is added to a solution already containing one of its ions, decreasing the solubility of the salt due to Le Chatelier's principle.
Selective and Fractional Precipitation
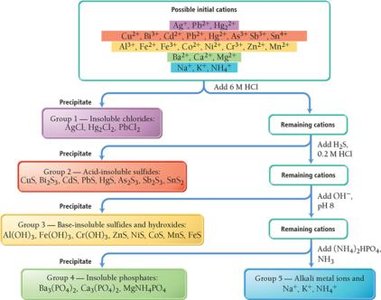
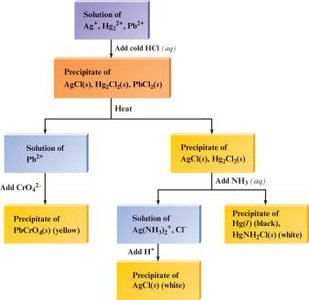
Selective precipitation is used to separate ions by adding a reagent that precipitates one ion before another. Fractional precipitation achieves separation by exploiting differences in Ksp values.
Complex Ions
Formation and Stability
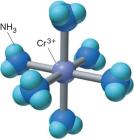
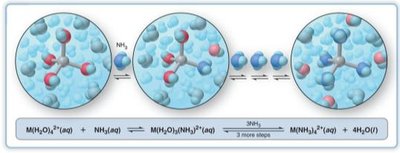
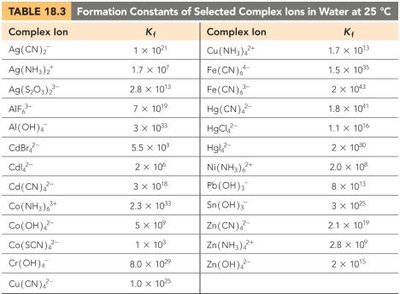
Complex ions consist of a central metal ion bonded to ligands (anions or molecules). The formation constant (Kf) quantifies the stability of the complex.
Example:
Kf values are typically very large, indicating stable complexes.
Summary of Key Concepts
Buffers resist pH changes by neutralizing added acids or bases.
The Henderson-Hasselbalch equation is used to calculate buffer pH.
Titration curves illustrate pH changes during acid-base reactions.
Indicators signal the endpoint of titrations by color change.
Ksp values determine solubility and precipitation of salts.
The common ion effect reduces solubility in the presence of a shared ion.
Selective and fractional precipitation are used for ion separation.
Complex ions form when metal ions bond to ligands, with stability described by Kf.
