 Back
BackChemical Equilibrium and Solubility: AP Chemistry Unit 7 Study Guide
Study Guide - Smart Notes
 Tailored notes based on your materials, expanded with key definitions, examples, and context.
Equilibrium Fundamentals
Introduction to Chemical Equilibrium
Chemical equilibrium occurs when the rates of the forward and reverse reactions are equal, resulting in constant concentrations of reactants and products over time. This concept is central to understanding reversible reactions in chemistry.
Reversible Processes: Many chemical reactions can proceed in both directions, such as evaporation/condensation, dissolution/precipitation, acid-base, and redox reactions.
Equilibrium Condition: At equilibrium, the concentrations of all species remain constant, though reactions continue to occur at equal rates in both directions.
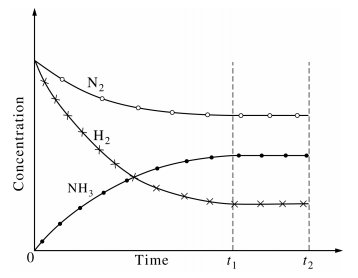
Graphical Representation: Equilibrium is visually indicated when concentration curves level off.
Example: The reaction between H2 and N2 to form NH3 demonstrates equilibrium when the concentrations of all species stabilize.
Equilibrium Expressions and Constants
The equilibrium constant (K) quantifies the ratio of product to reactant concentrations at equilibrium. It is specific to each reaction and depends on temperature.
Kc: Based on concentrations (mol/L).
Kp: Based on partial pressures (atm).
Reaction Quotient (Q): Used to determine the direction a reaction will shift to reach equilibrium.
Exclusion of Solids and Liquids: Only gases and aqueous species are included in equilibrium expressions.
Example: For H2(g) + I2(s) ⇄ 2HI(g),
Using RICE Tables
RICE tables (Reaction, Initial, Change, Equilibrium) are a systematic way to solve equilibrium problems, especially when initial and final values are given.
Setup: List initial concentrations, changes (using x), and equilibrium values.
Example: For COCl2(g) ⇄ CO(g) + Cl2(g), if initial pressure is 1.0 atm and equilibrium total pressure is 1.2 atm, use the change in pressure to solve for equilibrium concentrations.
Comparing K Values
The magnitude of K indicates whether products or reactants are favored at equilibrium.
K > 1: Products are favored.
K < 1: Reactants are favored.
Very large K: Reaction proceeds nearly to completion.
Very small K: Reaction barely proceeds.
Manipulating Equilibrium
Relationship Between K and the Chemical Equation
Changes to the chemical equation require adjustments to the equilibrium constant.
Reversing the equation: Invert K.
Multiplying coefficients: Raise K to the power of the factor.
Adding reactions: Multiply the K values of the individual reactions.


Solving for Equilibrium Concentrations
Equilibrium concentrations can be calculated using the RICE table and the equilibrium constant expression.
Quadratic Formula: Sometimes required if the equilibrium expression is quadratic.
x-is-small Approximation: Used when x is much smaller than initial concentrations (error < 5%).
Example: For N2(g) + O2(g) ⇄ 2NO(g), , use RICE table and solve for x.

Le Chatelier's Principle and Shifts in Equilibrium
Effect of Concentration Changes
Adding or removing reactants/products causes the system to shift to reestablish equilibrium.
Q < K: Reaction shifts right (toward products).
Q > K: Reaction shifts left (toward reactants).
Example: Adding NO2 to N2O4 ⇄ 2NO2 causes Q > K, so the reaction shifts left.

Effect of Volume and Pressure
Changing the volume (or pressure) of a gaseous system shifts equilibrium toward the side with fewer or more moles of gas.
Decrease volume (increase pressure): Shifts toward fewer moles of gas.
Increase volume (decrease pressure): Shifts toward more moles of gas.
Example: N2(g) + 3H2(g) ⇄ 2NH3(g) shifts right when volume decreases.

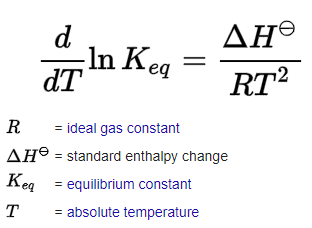
Effect of Temperature
Temperature changes affect the equilibrium constant (K), not Q. Heat can be considered a reactant (endothermic) or product (exothermic).
Exothermic: Increase temperature shifts left; decrease shifts right.
Endothermic: Increase temperature shifts right; decrease shifts left.
Van 't Hoff Equation: Relates enthalpy change to the equilibrium constant.
Solubility Equilibria
Solubility-Product Constant (Ksp)
Ksp describes the equilibrium between a solid salt and its ions in solution. It is used to predict solubility and calculate molar solubility.
Ksp Expression: For CaF2(s) ⇄ Ca2+(aq) + 2F-(aq),
Magnitude: Higher Ksp means more soluble; lower Ksp means less soluble.
Solubility Table: Qualitative and quantitative data for common salts.
Molar Solubility Calculations
Molar solubility is the number of moles of solute that can dissolve per liter before saturation. It can be calculated from Ksp using RICE tables.
Example: For PbCl2(s) ⇄ Pb2+(aq) + 2Cl-(aq), , solve for x.

Common Ion Effect
The solubility of a salt decreases when a solution already contains one of its ions. This is explained by Le Chatelier's Principle.
Example: CaF2(s) in a solution with NaF (common ion F-) will be less soluble.
Calculation: Adjust the Ksp expression to include the initial concentration of the common ion.

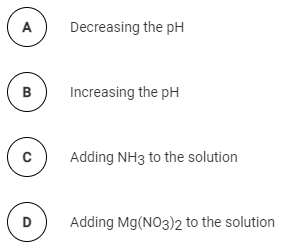
Effect of pH on Solubility
Solubility is affected by pH when one of the ions is a weak acid or base. Increasing acidity (lower pH) increases solubility of salts with basic anions.
Example: Mg(OH)2(s) ⇄ Mg2+(aq) + 2OH-(aq) becomes more soluble as pH decreases.
Thermodynamics and Equilibrium
Gibbs Free Energy (ΔG°)
Gibbs free energy change determines whether a reaction is spontaneous and relates to equilibrium. It combines enthalpy and entropy:
Equation:
Spontaneity: Negative ΔG means spontaneous; positive ΔG means non-spontaneous.
Entropy (S): A measure of disorder; higher entropy means more disorder.
Free Energy and Dissolution
The free energy change for dissolution reflects the breaking of intermolecular forces, reorganization of solvent, and interaction of dissolved species. Predicting the total ΔG can be complex due to competing factors.
Practice and Application
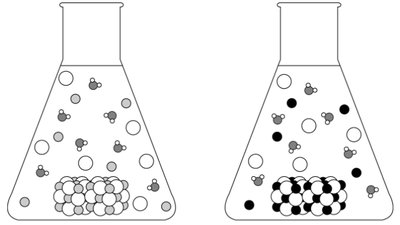
Particle Diagrams and Solubility
Particle diagrams help visualize the dissolution process and the relative solubility of compounds.
Example: Comparing FeCO3 and MnCO3 solubility using particle diagrams and Ksp values.
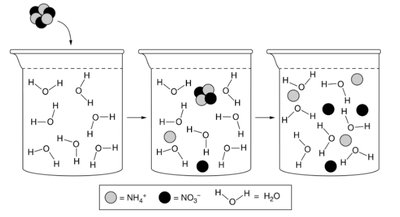
Entropy and Dissolution
When ionic compounds dissolve, entropy usually increases as ions disperse in solution.
Example: Dissolution of NH4NO3 in water increases entropy.
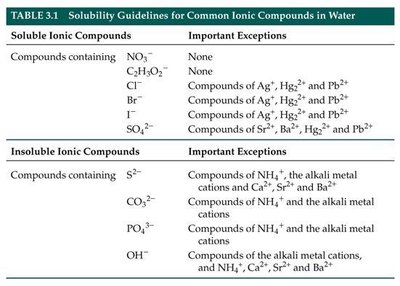
Summary Table: Solubility Guidelines
Solubility rules help predict whether a compound will dissolve in water.

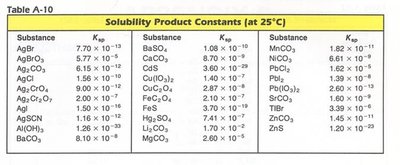
Summary Table: Solubility Product Constants
Ksp values for common salts provide quantitative data for solubility calculations.
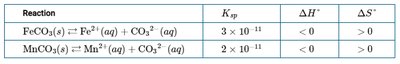
Summary Table: FeCO3 and MnCO3 Dissolution
Comparison of Ksp, ΔH, and ΔS for FeCO3 and MnCO3 dissolution.
Additional info: This study guide covers all major aspects of chemical equilibrium and solubility as outlined in AP Chemistry Unit 7, including graphical, tabular, and particle diagram representations, and provides practice questions for application.
