 Back
BackChemical Kinetics and Equilibrium: Study Notes for General Chemistry
Study Guide - Smart Notes
 Tailored notes based on your materials, expanded with key definitions, examples, and context.
Chemical Kinetics
Rates of Reaction and the Particulate Nature of Matter
Chemical kinetics is the study of the speed at which chemical reactions occur and the factors that influence these rates. The rate of a reaction is determined by monitoring the change in concentration of reactants or products over time.
Key Point 1: The disappearance of reactants and appearance of products can be measured to determine reaction rate.
Key Point 2: The rate is always positive and is typically expressed in units of concentration per unit time (e.g., mol/L·s).
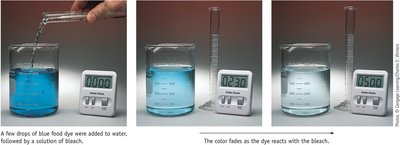
Example: The fading of blue dye in water when bleach is added demonstrates the decrease in dye concentration over time as the reaction proceeds.
Defining and Measuring the Rate of a Chemical Reaction
The rate of a chemical reaction can be measured as the change in concentration of a reactant or product per unit time. For a generic reaction:
aA + bB → cC + dD
Key Point 1: The rate is related to the stoichiometric coefficients and can be written as:
Key Point 2: Reactants decrease (negative rate), products increase (positive rate).
Example: For 2 SO2(g) + O2(g) → 2 SO3(g):
Graphical Analysis of Reaction Rate
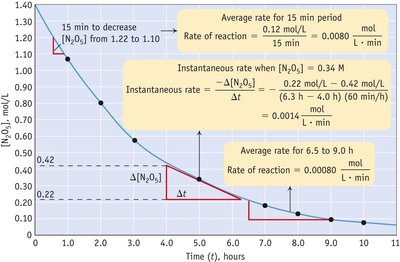
Reaction rates can be visualized using concentration vs. time graphs. The slope of the curve at any point gives the instantaneous rate, while the slope over a time interval gives the average rate.
Key Point 1: The steeper the slope, the faster the reaction rate.
Key Point 2: The rate typically decreases as reactants are consumed.
Example: The initial rate is calculated from the slope at the beginning of the reaction.
Rate Laws and Reaction Order
Effect of Concentration on Reaction Rate: Rate Laws
The rate law expresses the relationship between the rate of a reaction and the concentrations of reactants. For a general reaction:
aA + bB → xX
Key Point 1: The rate law is written as:
Key Point 2: The exponents x and y (orders) must be determined experimentally and may be whole numbers, zero, or fractions.
Key Point 3: The overall order is the sum of the exponents.
Example: If Rate = k[A][B]2, the reaction is first order in A, second order in B, and third order overall.
Units for the Rate Constant
The units of the rate constant (k) depend on the overall order of the reaction:
First-order:
Second-order:
Zero-order:
Determining the Rate Law: Method of Initial Rates
The method of initial rates involves measuring the initial rate of reaction for different concentrations of reactants to determine the order with respect to each reactant.
Key Point 1: By comparing experiments where only one reactant concentration changes, the order can be deduced.
Example: For 2 H2(g) + 2 NO(g) → N2(g) + 2 H2O(l), the rate law is found to be Rate = k[H2][NO]2.
Integrated Rate Laws
Integrated Rate Laws for Different Orders
Integrated rate laws relate reactant concentration to time for different reaction orders:
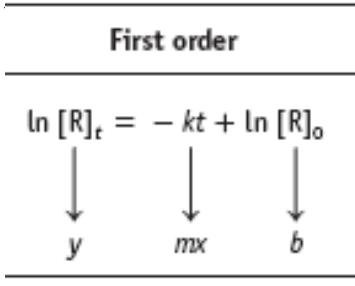
First-order:
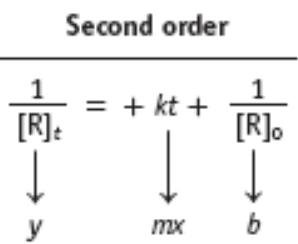
Second-order:
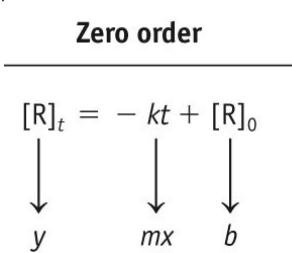
Zero-order:

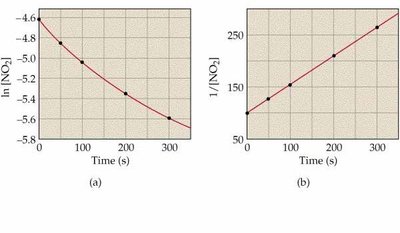
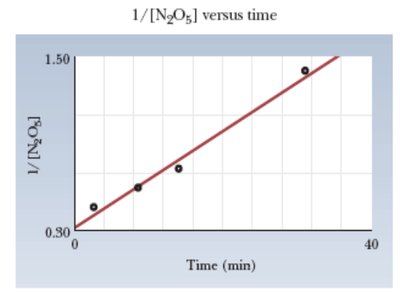
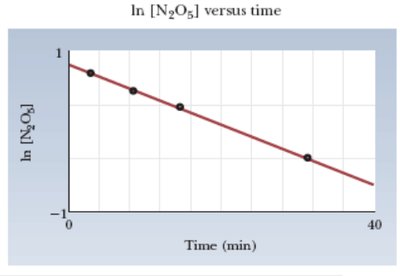
![Second-order kinetics: ln[NO2] vs. time and 1/[NO2] vs. time](https://static.studychannel.pearsonprd.tech/study_guide_files/general-chemistry/sub_images/99666cfd_image_15.png)
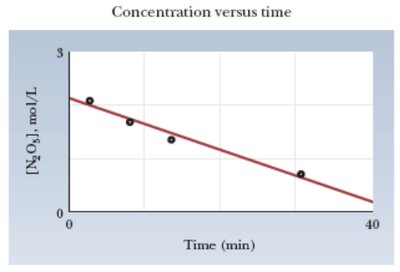
Graphical Determination of Reaction Order
To determine the order of a reaction, plot the appropriate function of concentration versus time:
Zero-order: [R] vs. time is linear
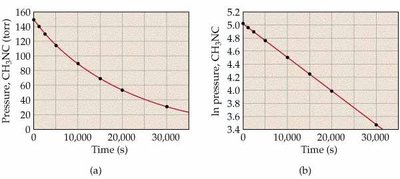
First-order: ln[R] vs. time is linear
Second-order: 1/[R] vs. time is linear
Collision Theory and Factors Affecting Reaction Rate
Collision Theory
Collision theory explains how chemical reactions occur and why reaction rates vary. For a reaction to occur, reactant molecules must collide with proper orientation and sufficient energy.
Key Point 1: Increasing concentration increases collision frequency, raising the reaction rate.
Key Point 2: Increasing temperature increases the energy of collisions, making reactions faster.
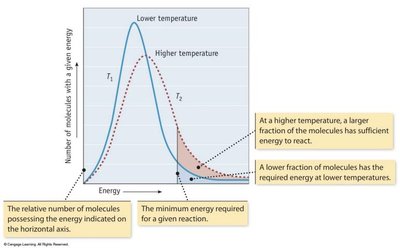
Effect of Temperature on Reaction Rate
Higher temperatures result in more molecules having enough energy to overcome the activation energy barrier, thus increasing the reaction rate.
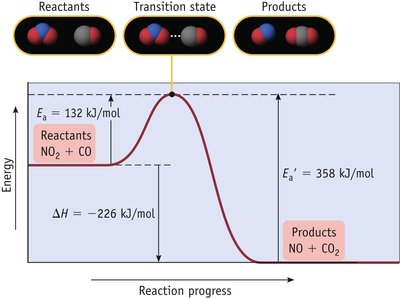
Reaction Coordinate Diagram and Activation Energy
The reaction coordinate diagram illustrates the energy changes during a reaction. The activation energy (Ea) is the minimum energy required for a reaction to occur.
Key Point 1: The higher the activation energy, the slower the reaction.
Key Point 2: The transition state is the highest energy point along the reaction path.

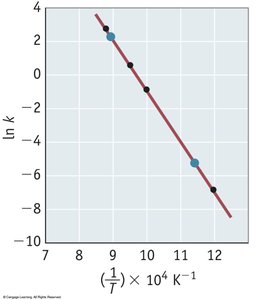
The Arrhenius Equation
The Arrhenius equation relates the rate constant to temperature and activation energy:
Key Point 1: As temperature increases, the rate constant increases.
Key Point 2: The equation can be linearized for graphical analysis:
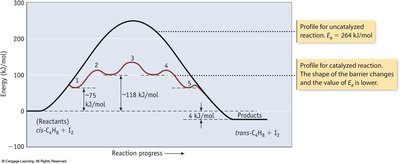
Catalysis
Catalysts and Reaction Mechanisms
A catalyst increases the rate of a reaction by providing an alternative pathway with a lower activation energy. Catalysts are not consumed in the reaction.
Key Point 1: Homogeneous catalysts are in the same phase as reactants; heterogeneous catalysts are in a different phase.
Key Point 2: Enzymes are biological catalysts that greatly accelerate reaction rates.
Chemical Equilibrium
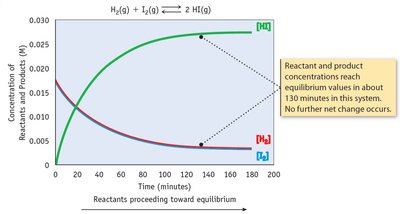
The Concept of Dynamic Equilibrium
Chemical equilibrium occurs when the rates of the forward and reverse reactions are equal, and the concentrations of reactants and products remain constant.
Key Point 1: Equilibrium is dynamic; reactions continue to occur, but there is no net change.
Example: H2(g) + I2(g) ⇄ 2 HI(g) reaches equilibrium when the rates of formation and decomposition of HI are equal.

The Equilibrium Constant (K)
The equilibrium constant quantifies the ratio of product and reactant concentrations at equilibrium for a given reaction:
Key Point 1: Only concentrations of gases and solutes are included; pure solids and liquids are omitted.
Key Point 2: K can be expressed in terms of concentration (Kc) or partial pressure (Kp).
Relating Kc and Kp
For reactions involving gases, Kp and Kc are related by:
where Δn is the change in moles of gas.
Le Chatelier’s Principle
Le Chatelier’s Principle states that if a system at equilibrium is disturbed, it will shift to counteract the disturbance and restore equilibrium.
Key Point 1: Adding reactant shifts equilibrium toward products; adding product shifts toward reactants.
Key Point 2: Changes in temperature, pressure, or volume affect equilibrium position.
Acids and Bases
Definitions and Properties
Acids and bases are defined by their ability to donate or accept protons (Brønsted-Lowry theory) or produce H+ or OH- ions (Arrhenius theory).
Key Point 1: Strong acids and bases ionize completely; weak acids and bases ionize partially.
Key Point 2: The pH scale measures the acidity or basicity of a solution.
Equilibrium Constants for Acids and Bases
The acid dissociation constant (Ka) and base dissociation constant (Kb) quantify the strength of weak acids and bases:
Key Point 1: The larger the Ka or Kb, the stronger the acid or base.
Key Point 2: Ka and Kb are related by where is the ionization constant of water.
Polyprotic Acids
Polyprotic acids can donate more than one proton, with each successive ionization having a smaller Ka value.
Key Point 1: The pH of a polyprotic acid solution is determined primarily by the first ionization step.
Summary Table: Reaction Orders and Integrated Rate Laws
Order | Integrated Rate Law | Graph for Linear Fit |
|---|---|---|
Zero | [R] vs. time | |
First | ln[R] vs. time | |
Second | 1/[R] vs. time |
Additional info: These notes cover the essential concepts of chemical kinetics, equilibrium, and acid-base chemistry, including graphical analysis, rate laws, integrated rate laws, collision theory, Arrhenius equation, catalysis, equilibrium constants, and acid-base equilibria. Images included are directly relevant to the explanation of each topic.
