 Back
BackChemical Kinetics and Equilibrium: Study Notes for General Chemistry
Study Guide - Smart Notes
 Tailored notes based on your materials, expanded with key definitions, examples, and context.
Chemical Kinetics
Rates of Reaction and the Particulate Nature of Matter
Chemical kinetics is the study of the speed at which chemical reactions occur and the factors that affect these rates. The rate of a reaction is determined by monitoring the change in concentration of reactants or products over time.
Key Point 1: Reactants decrease and products increase as a reaction proceeds.
Key Point 2: The rate can be measured by the disappearance of reactants or the appearance of products.
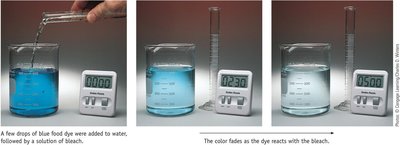
Example: The fading of blue dye when mixed with bleach demonstrates the decrease in dye concentration over time.
Defining and Measuring the Rate of a Chemical Reaction
The rate of a chemical reaction is expressed as the change in concentration of a reactant or product per unit time. Rates are always positive and are often normalized by stoichiometric coefficients.
Key Point 1: Rate = (change in concentration)/(change in time).
Key Point 2: For a reaction aA + bB → cC + dD, the rate is given by:
Example: In 2 SO2(g) + O2(g) → 2 SO3(g), SO3 appears twice as fast as SO2 disappears.
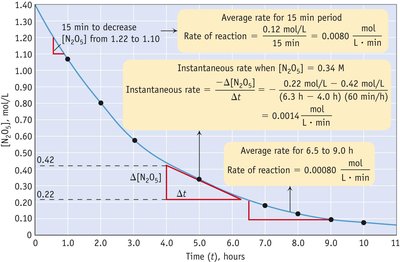
Graphical Analysis of Reaction Rate
Reaction rates can be analyzed using concentration vs. time graphs. The slope of the curve at any point gives the instantaneous rate, while the slope over an interval gives the average rate.
Key Point 1: Average rate is the slope over a time interval; instantaneous rate is the slope at a specific point.
Key Point 2: The rate decreases as reactants are consumed.
Example: The initial rate of dye disappearance can be calculated from the slope of the concentration-time curve.

Factors Affecting Reaction Rate
Several factors influence the rate of a chemical reaction, including concentration, temperature, surface area, and catalysis.
Key Point 1: Higher concentration increases collision frequency, raising the rate.
Key Point 2: Higher temperature increases molecular energy, leading to more effective collisions.
Key Point 3: Catalysts provide alternative pathways with lower activation energy.
Rate Laws and Reaction Order
The rate law expresses the relationship between reaction rate and reactant concentrations. The order of a reaction with respect to each reactant is determined experimentally.
Key Point 1: General rate law:
Key Point 2: The overall order is the sum of the exponents.
Example: If Rate = k[A][B]2, the reaction is first order in A, second order in B, and third order overall.
Units for the Rate Constant
The units of the rate constant depend on the overall order of the reaction.
Key Point 1: First-order:
Key Point 2: Second-order:
Key Point 3: Third-order:
Method of Initial Rates
The method of initial rates involves varying the concentration of one reactant while keeping others constant to determine reaction order.
Key Point 1: Compare rates from different experiments to deduce exponents in the rate law.
Example: For 2 H2(g) + 2 NO(g) → N2(g) + 2 H2O(l), experimental data can be used to determine the order with respect to H2 and NO.
Experiment | [H2] (M) | [NO] (M) | Initial Rate (M s-1) |
|---|---|---|---|
1 | 0.122 | 0.42 | 0.136 |
2 | 0.122 | 0.21 | 0.0339 |
3 | 0.244 | 0.21 | 0.0678 |
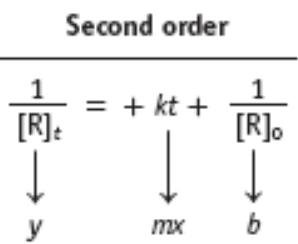
Integrated Rate Laws
Integrated rate laws relate reactant concentration to time for different reaction orders.
Key Point 1: First-order:
Key Point 2: Second-order:
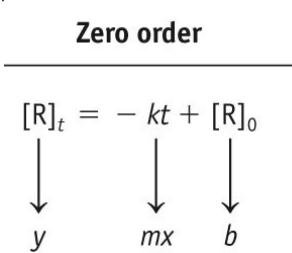
Key Point 3: Zero-order:
Example: Sucrose decomposition follows first-order kinetics.

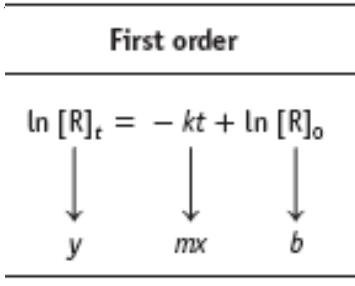
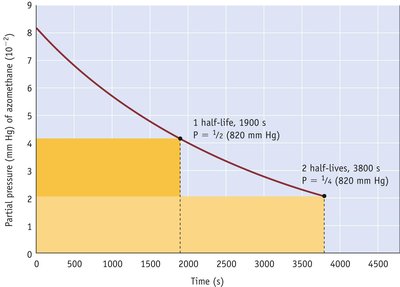
Half-Life of First-Order Reactions
The half-life is the time required for the concentration of a reactant to decrease by half. For first-order reactions, it is independent of initial concentration.
Key Point 1:
Key Point 2: All nuclear decays are first-order.
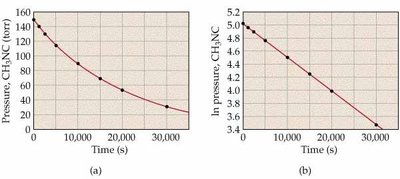
Graphical Determination of Reaction Order
Plotting concentration, ln(concentration), or 1/concentration versus time helps determine reaction order.
Key Point 1: Zero-order: [R] vs. time is linear.
Key Point 2: First-order: ln[R] vs. time is linear.
Key Point 3: Second-order: 1/[R] vs. time is linear.
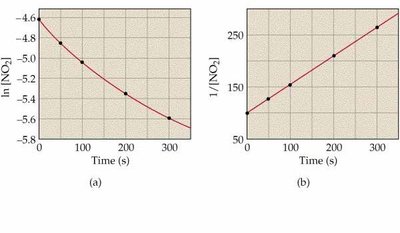
![Second order kinetics: ln[NO2] vs. t and 1/[NO2] vs. t](https://static.studychannel.pearsonprd.tech/study_guide_files/general-chemistry/sub_images/39a11f48_image_15.png)
Collision Theory and Temperature Effects
Collision Theory
Collision theory states that molecules must collide with proper orientation and sufficient energy to react. Increasing concentration or temperature increases the rate by increasing collision frequency and energy.
Key Point 1: Effective collisions require correct orientation and energy.
Key Point 2: Higher concentration and temperature increase reaction rate.
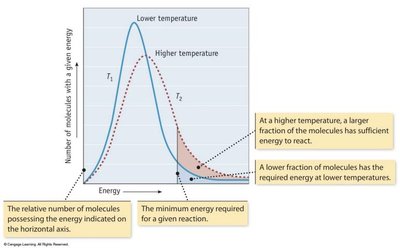
Effect of Temperature on Reaction Rate
Temperature increases the average kinetic energy of molecules, resulting in more collisions with enough energy to overcome the activation energy barrier.
Key Point 1: At higher temperatures, more molecules have sufficient energy to react.
Key Point 2: The rate constant increases with temperature.
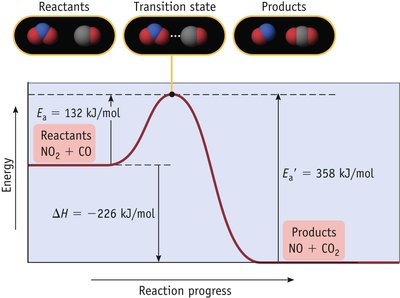
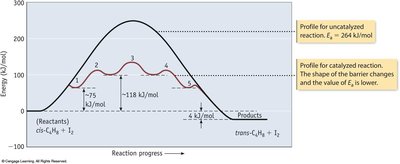
Reaction Coordinate Diagram and Activation Energy
The reaction coordinate diagram illustrates the energy changes during a reaction. The activation energy (Ea) is the minimum energy required for a reaction to occur.
Key Point 1: The transition state is the highest energy point along the reaction path.
Key Point 2: Lower activation energy means a faster reaction.

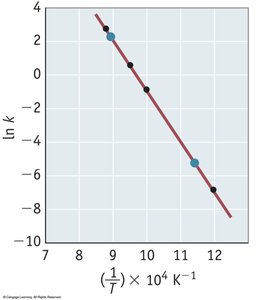
The Arrhenius Equation
The Arrhenius equation relates the rate constant to temperature and activation energy:
Key Point 1:
Key Point 2: A plot of ln(k) vs. 1/T yields a straight line with slope -Ea/R.


Catalysis
Catalysts and Reaction Pathways
Catalysts increase reaction rates by providing alternative pathways with lower activation energy. They are not consumed in the reaction.
Key Point 1: Homogeneous catalysts are in the same phase as reactants; heterogeneous catalysts are in a different phase.
Key Point 2: Enzymes are biological catalysts that greatly accelerate reaction rates.
Chemical Equilibrium
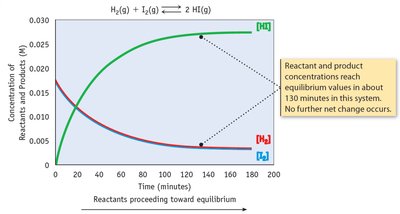
Dynamic Equilibrium
At equilibrium, the rates of the forward and reverse reactions are equal, and concentrations of reactants and products remain constant.
Key Point 1: Equilibrium is dynamic, not static.
Key Point 2: The equilibrium constant (K) quantifies the ratio of product to reactant concentrations.

Equilibrium Constant Expressions
The equilibrium constant expression for a reaction is written using the concentrations of products and reactants, each raised to the power of their stoichiometric coefficients.
Key Point 1:
Key Point 2: Pure solids and liquids are omitted from the expression.
Relating Kc and Kp
For reactions involving gases, equilibrium constants can be expressed in terms of concentrations (Kc) or partial pressures (Kp). The relationship is:
Key Point 1: , where Δn is the change in moles of gas.
Reaction Quotient (Q) and Predicting Direction
The reaction quotient, Q, is calculated using current concentrations. Comparing Q to K determines the direction the reaction will proceed to reach equilibrium.
Key Point 1: If Q < K, the reaction proceeds forward.
Key Point 2: If Q > K, the reaction proceeds in reverse.
Key Point 3: If Q = K, the system is at equilibrium.
ICE Tables for Equilibrium Calculations
ICE tables (Initial, Change, Equilibrium) are used to organize data and solve for equilibrium concentrations.
Key Point 1: Set up initial concentrations, changes based on stoichiometry, and solve for equilibrium values.
Example: For N2(g) + 3 H2(g) ⇄ 2 NH3(g), use ICE tables to calculate Kc.
Le Chatelier’s Principle
Le Chatelier’s Principle states that a system at equilibrium will adjust to counteract any imposed change (stress) in concentration, temperature, or pressure.
Key Point 1: Adding reactant shifts equilibrium right; adding product shifts left.
Key Point 2: Removing reactant shifts equilibrium left; removing product shifts right.
Key Point 3: Increasing temperature affects K; treat heat as a reactant (endothermic) or product (exothermic).
Key Point 4: Increasing pressure (decreasing volume) shifts equilibrium toward fewer gas molecules.
Acids and Bases
Arrhenius and Brønsted-Lowry Definitions
Acids produce H+ ions in solution; bases produce OH- ions. Brønsted-Lowry theory defines acids as proton donors and bases as proton acceptors.
Key Point 1: Monoprotic acids donate one proton; polyprotic acids donate more than one.
Key Point 2: Amphiprotic substances can act as either acid or base (e.g., water).
Conjugate Acid-Base Pairs
Conjugate acid-base pairs differ by one proton. Every acid-base reaction involves two pairs.
Key Point 1: The conjugate acid has the extra H+; the conjugate base is what remains after losing H+.
Strong and Weak Acids and Bases
Strong acids and bases ionize completely in water; weak acids and bases ionize partially.
Key Point 1: Strong acids: HCl, HBr, HI, HClO4, HNO3, H2SO4.
Key Point 2: Strong bases: Group IA hydroxides, Sr(OH)2, Ba(OH)2.
Key Point 3: Weak acids and bases require equilibrium calculations to determine [H3O+] or [OH-].
Acid and Base Ionization Constants (Ka and Kb)
Ka and Kb quantify the strength of weak acids and bases. Larger values indicate stronger acids or bases.
Key Point 1:
Key Point 2:
Autoionization of Water and pH Scale
Water autoionizes to produce H3O+ and OH-. The product of their concentrations is the ionization constant, Kw.
Key Point 1: at 25°C.
Key Point 2: pH = -log[H3O+]; pOH = -log[OH-]; pH + pOH = 14.
Acid-Base Properties of Salts
Salts can affect the pH of a solution depending on the acid-base properties of their constituent ions.
Key Point 1: Conjugate bases of strong acids and Group IA/IIA cations have no effect on pH.
Key Point 2: Conjugate bases of weak acids and conjugate acids of weak bases can make solutions basic or acidic, respectively.
Salt | pH of (aq) solution |
|---|---|
KCl | Neutral |
NaCH3COO | Basic |
NH4Cl | Acidic |
Na2CO3 | Basic |
(NH4)2CO3 | Basic |
Polyprotic Acids and Bases
Polyprotic acids can donate more than one proton, with each successive ionization having a smaller Ka value. Calculations for their solutions require stepwise equilibrium analysis.
Key Point 1: Each ionization step is treated separately, using ICE tables and equilibrium expressions.
Example: H2CO3 ionizes in two steps, each with its own Ka.
Lewis Acids and Bases
Lewis acids are electron pair acceptors; Lewis bases are electron pair donors. This definition expands acid-base chemistry beyond proton transfer.
Key Point 1: Many metal ions act as Lewis acids.
Key Point 2: Molecules with lone pairs (e.g., NH3) act as Lewis bases.
Conjugate Acid-Base Relationship: Ka and Kb
The product of Ka for an acid and Kb for its conjugate base equals Kw. The stronger the acid, the weaker its conjugate base.
Key Point 1:
Key Point 2: pKa + pKb = 14 at 25°C.
Predicting Acid-Base Equilibrium Position
Acid-base reactions favor the formation of the weaker acid and weaker base. The equilibrium lies toward the side with the less reactive species.
Key Point 1: Compare Ka values to determine which acid is stronger.
Key Point 2: The stronger acid and base react to form the weaker acid and base.
Quantitative Acid-Base Calculations
Calculating pH after mixing acids and bases involves determining moles, concentrations, and using equilibrium constants.
Key Point 1: Use ICE tables and equilibrium expressions for weak acids/bases.
Key Point 2: For strong acids/bases, assume complete ionization.
Summary Table: Reaction Orders and Integrated Rate Laws
Order | Integrated Rate Law | Graph for Linear Fit |
|---|---|---|
Zero | [R] vs. time | |
First | ln[R] vs. time | |
Second | 1/[R] vs. time |
