 Back
BackChemical Kinetics: Reaction Rates, Rate Laws, and Temperature Effects
Study Guide - Smart Notes
 Tailored notes based on your materials, expanded with key definitions, examples, and context.
Chemical Kinetics
Introduction to Reaction Rates
Chemical kinetics is the study of the speed at which chemical reactions occur and the factors that affect these rates. Understanding reaction rates is essential for predicting how quickly products form and reactants are consumed.
Reaction Rate: The change in concentration of a reactant or product per unit time, typically expressed in M/s.
Factors Affecting Rate: Concentration of reactants, temperature, presence of catalysts, and surface area.
Rate Laws and Reaction Order
Rate laws express the relationship between the rate of a reaction and the concentration of its reactants. The form and order of the rate law must be determined experimentally.
General Rate Law: where k is the rate constant and n is the order with respect to reactant A.
Reaction Order: The exponent n indicates how the rate depends on the concentration of A. The sum of all exponents gives the overall order.
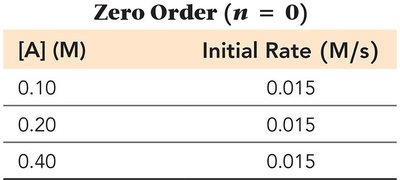
Zero Order: Rate is independent of reactant concentration.
First Order: Rate is directly proportional to reactant concentration.
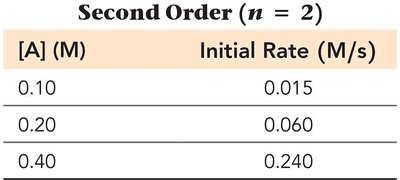
Second Order: Rate is proportional to the square of reactant concentration.
Experimental Determination of Rate Laws
The order of a reaction is determined by measuring initial rates at varying reactant concentrations.
Method of Initial Rates: Compare how changes in concentration affect the initial rate.
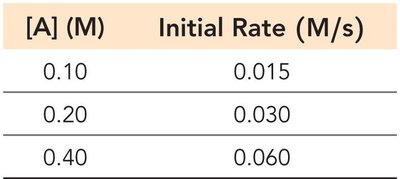
Example Tables
These tables illustrate how initial rate changes with concentration for different orders:
[A] (M) | Initial Rate (M/s) |
|---|---|
0.10 | 0.015 |
0.20 | 0.030 |
0.40 | 0.060 |
[A] (M) | Initial Rate (M/s) |
|---|---|
0.10 | 0.015 |
0.20 | 0.015 |
0.40 | 0.015 |
[A] (M) | Initial Rate (M/s) |
|---|---|
0.10 | 0.015 |
0.20 | 0.060 |
0.40 | 0.240 |
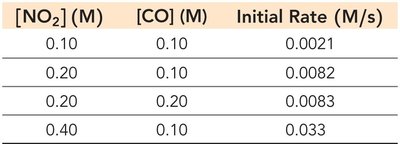
Multiple Reactants
[NO2] (M) | [CO] (M) | Initial Rate (M/s) |
|---|---|---|
0.10 | 0.10 | 0.0021 |
0.20 | 0.10 | 0.0082 |
0.20 | 0.20 | 0.0083 |
0.40 | 0.10 | 0.033 |
Integrated Rate Laws
Integrated rate laws relate reactant concentration to time, allowing calculation of concentrations at any point during the reaction.
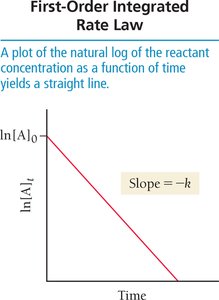
First Order:
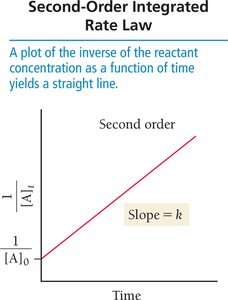
Second Order:
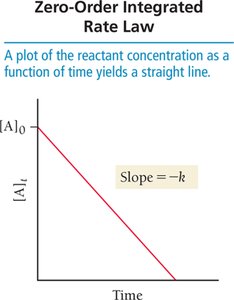
Zero Order:
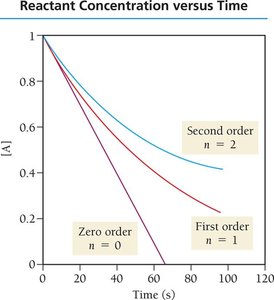
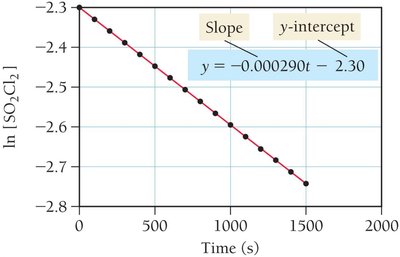
Graphical Representations
First order: Plot of vs. time yields a straight line with slope .
Second order: Plot of vs. time yields a straight line with slope .
Zero order: Plot of vs. time yields a straight line with slope .
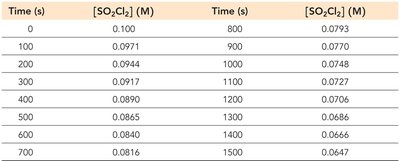
Example Data and Plots
Time (s) | [SO2Cl2] (M) |
|---|---|
0 | 0.100 |
100 | 0.0971 |
200 | 0.0944 |
... | ... |
1500 | 0.0647 |
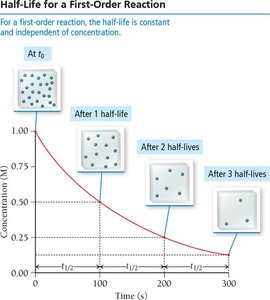
Half-Life of Reactions
The half-life () is the time required for the concentration of a reactant to decrease by half.
First Order: (constant, independent of concentration)
Second Order: (depends on initial concentration)
Zero Order: (depends on initial concentration)
Summary Table: Rate Laws and Integrated Rate Laws
Order | Rate Law | Integrated Rate Law | Straight-Line Plot | Half-Life Expression |
|---|---|---|---|---|
Zero | Rate = k | [A] vs. time | ||
First | Rate = k[A] | ln[A] vs. time | ||
Second | Rate = k[A]^2 | 1/[A] vs. time |
Temperature and Reaction Rate
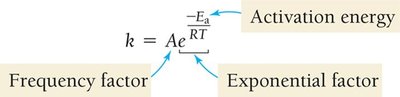
The Arrhenius Equation
The rate constant k depends on temperature, described by the Arrhenius equation:
A: Frequency factor (number of times reactants approach the activation barrier per unit time)
Ea: Activation energy (minimum energy required to initiate the reaction)
R: Gas constant (8.314 J/mol·K)
T: Temperature in Kelvin
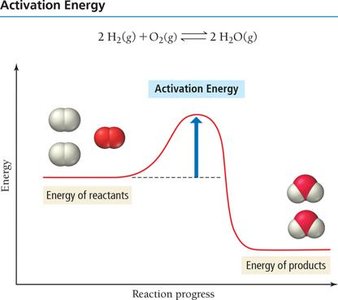
Activation Energy and Reaction Energy Profile
Activation energy is the energy barrier that must be overcome for a reaction to proceed. The activated complex (transition state) is formed at the peak of this barrier.
Higher activation energy means fewer molecules have enough energy to react.
Increasing temperature increases the fraction of molecules with sufficient energy.
Thermal Energy Distribution
As temperature increases, more molecules have enough energy to surpass the activation energy barrier, leading to faster reaction rates. 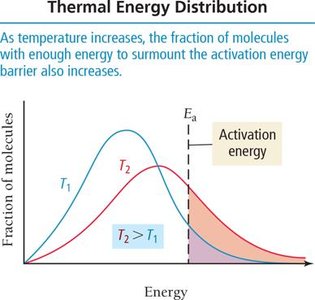
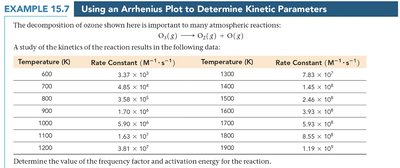
Arrhenius Plots and Two-Point Form
Plotting vs. yields a straight line with slope and intercept .
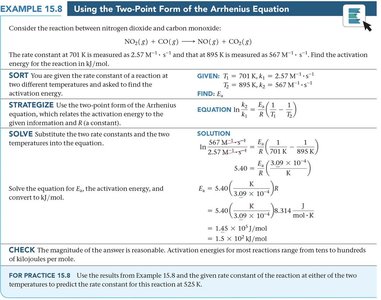
Two-point form:
Key Takeaways
Reaction rates depend on reactant concentration, reaction order, and temperature.
Rate laws must be determined experimentally.
Integrated rate laws allow calculation of concentrations at any time.
Temperature increases reaction rate by increasing the fraction of molecules with sufficient energy.
The Arrhenius equation quantitatively relates rate constant to temperature and activation energy.
