 Back
BackChemical Kinetics: Temperature and Reaction Rates (Arrhenius Equation)
Study Guide - Smart Notes
 Tailored notes based on your materials, expanded with key definitions, examples, and context.
Chemical Kinetics
Temperature and Reaction Rates: The Arrhenius Equation
Chemical kinetics is the study of reaction rates and the factors that affect them. One of the most important relationships in kinetics is the Arrhenius equation, which describes how the rate constant of a reaction depends on temperature and activation energy.
The Arrhenius Equation
The Arrhenius equation mathematically relates the rate constant (k) to the activation energy (Ea), the absolute temperature (T), and the frequency factor (A):
k: Rate constant of the reaction
A: Frequency factor (pre-exponential factor), related to collision frequency and orientation probability
Ea: Activation energy (minimum energy required for reaction)
T: Absolute temperature (Kelvin)
R: Universal gas constant (8.314 J/K·mol)
The equation is:
The frequency factor, A, is the product of the collision frequency (Z) and an orientation probability factor (p): A = pZ.
Activation Energy and Reaction Progress
For a reaction to occur, molecules must collide with sufficient energy and proper orientation. The activation energy (Ea) is the minimum energy required to form the activated complex (transition state), where bonds are partially broken and formed. Not all collisions result in a reaction; only those with energy greater than Ea and correct orientation will proceed.
Ea is always positive and is characteristic for each reaction.
Higher Ea means slower reaction rate at a given temperature.
The activated complex is a high-energy, unstable state.
Potential energy profile diagrams illustrate the energy changes during a reaction, showing reactants, products, activation energy, and the transition state.
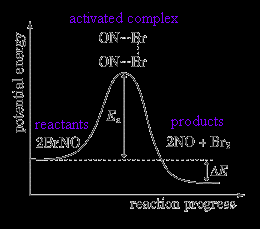
Example: In the reaction 2BrNO → 2NO + Br2, the diagram shows the energy barrier (Ea) and the formation of the activated complex.
Exothermic vs. Endothermic Reactions
Potential energy diagrams can represent both exothermic and endothermic reactions:
Exothermic: Energy of products is lower than reactants; energy is released.
Endothermic: Energy of products is higher than reactants; energy is absorbed.
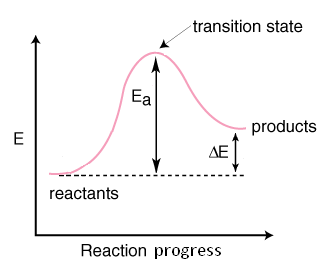
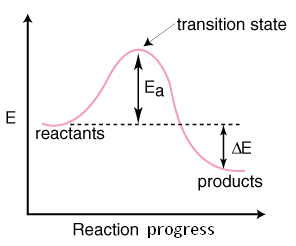
Comparison: Both diagrams show the activation energy (Ea) and the change in energy (ΔE) between reactants and products.
Effect of Temperature on Reaction Rate
Increasing temperature increases the average kinetic energy of molecules, resulting in a greater fraction of molecules with energy exceeding the activation energy. This leads to a higher reaction rate.
At higher temperatures, more molecules can overcome the energy barrier.
The shaded area under the energy distribution curve represents the fraction of molecules with enough energy to react.
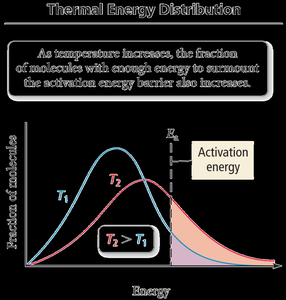
Example: The diagram shows that at higher temperature (T2), more molecules have energy greater than Ea compared to lower temperature (T1).
The Frequency Factor (A) and Exponential Factor
The frequency factor (A) is related to the frequency of collisions with proper orientation. It is specific for each reaction and usually treated as constant over a moderate temperature range.
The exponential factor depends on both activation energy and temperature:
Increases with higher temperature
Decreases with higher activation energy
Values range between 0 and 1
Low Ea and high T make the exponent small, so the factor approaches 1
High Ea and low T make the exponent large negative, so the factor approaches 0
The Arrhenius equation shows that k increases with increasing temperature and decreases with increasing activation energy.
Logarithmic Forms of the Arrhenius Equation
Taking the natural logarithm of both sides yields a linear equation:
A plot of ln k vs. 1/T is a straight line with slope (–Ea/R) and intercept ln A.
The slope can be used to determine Ea.
Example: In laboratory experiments, plotting ln k vs. 1/T allows determination of activation energy for a reaction.
Arrhenius Plot Example and Data Table
Experimental data for the effect of temperature on the rate constant:
T (ºC) | T (K) | 1/T (1/K) | k (M-1s-1) | ln k |
|---|---|---|---|---|
5.0 | 278.2 | 3.595E-3 | 4.93E-06 | -12.22 |
15.0 | 288.2 | 3.470E-3 | 1.40E-05 | -11.18 |
21.0 | 294.2 | 3.400E-3 | 4.54E-05 | -10.00 |
31.0 | 304.2 | 3.288E-3 | 8.96E-05 | -9.32 |
39.0 | 312.2 | 3.204E-3 | 2.14E-4 | -8.45 |
Application: Using the slope of the Arrhenius plot, activation energy can be calculated:
Example calculation:
Two-Point Form of the Arrhenius Equation
If rate constants are known at two temperatures, the activation energy or rate constant at another temperature can be calculated:
Used for calculating Ea or k at a given temperature
Example 1: Given k1 at T1, Ea, and T2, calculate k2:
Example 2: Given k1 and k2 at T1 and T2, calculate Ea:
Summary: The Arrhenius equation is a fundamental tool in chemical kinetics, allowing prediction and analysis of how temperature and activation energy affect reaction rates. Understanding the energy profile of reactions and the effect of temperature is essential for controlling and optimizing chemical processes.
