 Back
BackChapter 15 lecture 3
Study Guide - Smart Notes
 Tailored notes based on your materials, expanded with key definitions, examples, and context.
CHAPTER 15: CHEMICAL KINETICS
Temperature and Reaction Rates: The Arrhenius Equation
Chemical kinetics explores the speed at which chemical reactions occur and the factors that influence these rates. One of the most important relationships in kinetics is the Arrhenius equation, which connects the rate constant of a reaction to its activation energy and temperature.
Arrhenius Equation: Describes how the rate constant (k) depends on temperature (T) and activation energy (Ea).
Formula: where: - k: rate constant - A: frequency factor (product of collision frequency and orientation probability, A = pZ) - Ea: activation energy (J/mol) - R: universal gas constant (8.314 J/K·mol) - T: absolute temperature (K)
Exponential Factor: increases with higher temperature and decreases with higher activation energy.
Logarithmic Form: This linearizes the relationship for graphical analysis.
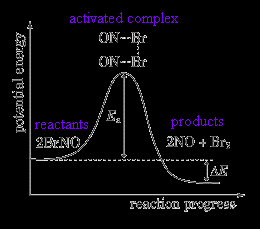
Activation Energy and Reaction Progress
For a reaction to occur, molecules must collide with sufficient energy and proper orientation. The minimum energy required is called the activation energy (Ea). The transition state or activated complex is formed when reactants reach this energy barrier.
Activation Energy (Ea): Always positive; represents the energy barrier for the reaction.
Activated Complex: A transient species with partially broken and formed bonds.
Effect of Ea: Higher Ea means slower reaction rate at a given temperature.
Potential Energy Profile: Shows the energy changes as reactants convert to products.
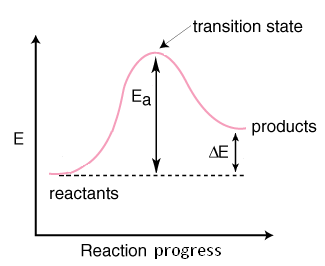
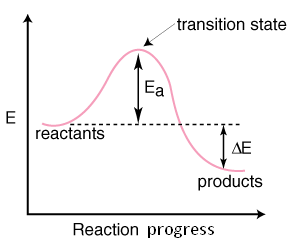
Comparison of Potential Energy Profiles: Exothermic vs. Endothermic Reactions
Potential energy diagrams illustrate the energy changes during a reaction. Exothermic reactions release energy, while endothermic reactions absorb energy.
Exothermic Reaction: Energy of products is lower than reactants; ΔE is negative.
Endothermic Reaction: Energy of products is higher than reactants; ΔE is positive.
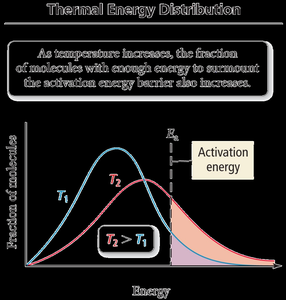
Effect of Temperature on Reaction Rate
Increasing temperature raises the average kinetic energy of molecules, increasing the fraction of molecules with energy greater than Ea. This results in a higher reaction rate.
Molecular Kinetic Theory: Higher temperature means more energetic collisions.
Fraction of Energetic Molecules: Represented by the shaded area under the energy distribution curve above Ea.
Arrhenius Equation: Shows that k increases with temperature.
Arrhenius Equation: Frequency Factor and Exponential Factor
The Arrhenius equation consists of two main components: the frequency factor (A) and the exponential factor ().
Frequency Factor (A): Related to collision frequency and orientation; usually treated as constant over a moderate temperature range.
Exponential Factor: Depends on Ea and T; values range from 0 to 1.
Low Ea and High T: Exponential factor approaches 1, reaction rate increases.
High Ea and Low T: Exponential factor approaches 0, reaction rate decreases.
Graphical and Two-Point Forms of the Arrhenius Equation
The logarithmic form of the Arrhenius equation allows determination of Ea from experimental data. A plot of ln k vs. 1/T yields a straight line with slope (–Ea/R).
Graphical Method: Requires multiple temperature measurements of k.
Two-Point Form: Used when k is known at two temperatures.
Applications: Calculate Ea or k at a given temperature.
Example Calculations
Example 1: Calculating k at a higher temperature given Ea and k1. Example 2: Calculating Ea given k at two temperatures.
Example 1:
Example 2:
Tabular Data: Effect of Temperature on Rate Constant
The following table summarizes experimental data showing how temperature affects the rate constant for a reaction:
T (ºC) | T (K) | 1/T (1/K) | k (M-1s-1) | ln k |
|---|---|---|---|---|
5.0 | 278.2 | 3.595E-3 | 4.93E-06 | -12.22 |
15.0 | 288.2 | 3.470E-3 | 1.40E-05 | -11.18 |
21.0 | 294.2 | 3.400E-3 | 4.54E-05 | -10.00 |
31.0 | 304.2 | 3.288E-3 | 8.96E-05 | -9.32 |
39.0 | 312.2 | 3.204E-3 | 2.14E-4 | -8.45 |
Purpose: Demonstrates the increase in rate constant with temperature, supporting the Arrhenius equation.
Summary
The Arrhenius equation quantitatively relates reaction rate to temperature and activation energy.
Activation energy is the energy barrier for a reaction; higher Ea means slower rates.
Temperature increases the fraction of molecules able to react, thus increasing the rate constant.
Graphical and two-point forms of the Arrhenius equation allow determination of Ea and prediction of rate constants.
