 Back
BackColligative Properties, Soaps, and Chemical Kinetics: Study Notes for General Chemistry
Study Guide - Smart Notes
 Tailored notes based on your materials, expanded with key definitions, examples, and context.
Colligative Properties and Osmosis
Osmosis and Semipermeable Membranes
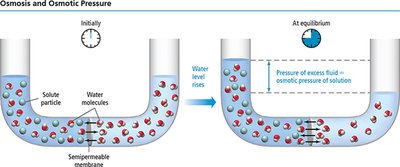
Osmosis is a fundamental process in chemistry where solvent molecules move from a region of low solute concentration to a region of high solute concentration, typically across a semipermeable membrane. This membrane allows only the solvent (not the solute) to pass through, resulting in a net flow of solvent.
Semipermeable membrane: A barrier that permits the passage of solvent molecules but blocks solute particles.
Osmotic flow: Occurs until equilibrium is reached, where the pressure of excess fluid equals the osmotic pressure of the solution.
Osmotic pressure (\( \Pi \)): The minimum pressure required to prevent the flow of solvent across the membrane. It is directly proportional to the molarity (M) of the solute: where \( M \) is molarity, \( R \) is the gas constant, and \( T \) is temperature in Kelvin.
Van’t Hoff Factor and Ion Pairing
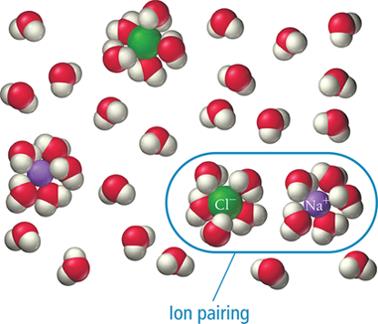
The van’t Hoff factor (\( i \)) describes the number of particles a solute produces in solution. For ionic compounds, \( i \) is greater than 1, but actual values are often less than theoretical due to ion pairing.
Van’t Hoff factor (\( i \)):
Ion pairing: Some ions associate in solution, reducing the effective number of particles.
Colligative properties: Properties that depend on the number of solute particles, not their identity (e.g., boiling point elevation, freezing point depression).
Van’t Hoff Factors Table
The table below compares expected and measured van’t Hoff factors for various solutes at 0.05 m concentration in aqueous solution. This illustrates the effect of ion pairing.
Solute | i Expected | i Measured |
|---|---|---|
Nonelectrolyte | 1 | 1 |
NaCl | 2 | 1.9 |
MgSO4 | 2 | 1.3 |
MgCl2 | 3 | 2.7 |
K2SO4 | 3 | 2.6 |
FeCl3 | 4 | 3.4 |
Boiling Point Elevation in Electrolyte Solutions
Electrolyte solutions have higher boiling points than nonelectrolyte solutions of the same concentration due to the greater number of solute particles.
Example: Among 0.50 M solutions of C12H22O11 (nonelectrolyte), NaCl, and MgCl2, MgCl2 will have the highest boiling point because it produces the most particles.
Soaps and Colloids
Structure and Function of Soap
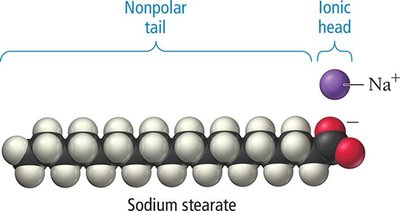
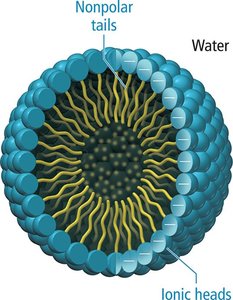
Soap molecules are fatty acid salts with a unique structure: an ionic (hydrophilic) head and a nonpolar (hydrophobic) tail. This allows them to form colloids and interact with both water and oily substances.
Hydrophilic head: Attracts water molecules.
Hydrophobic tail: Repels water, attracts oils.
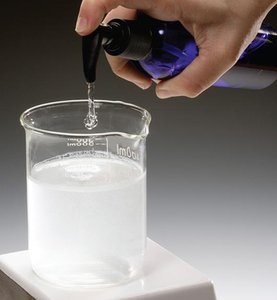
Micelle formation: Soap molecules aggregate into spherical structures (micelles) in water, trapping oils inside.
Emulsification: The process by which soaps disperse oils in water, enabling cleaning.
Chemical Kinetics
Reaction Rate
Chemical kinetics studies the speed of chemical reactions. The reaction rate is a measure of how quickly reactants are consumed or products are formed.
Reaction rate: or
Importance: Controlling reaction rates is crucial in industrial and biological processes.
Defining Reaction Rate
Reaction rates are typically measured by the change in concentration of a reactant or product over time. For reactants, a negative sign is used to indicate consumption.
Example reaction:
Rate expressions:
Reactant and Product Concentrations Over Time
As a reaction proceeds, reactant concentrations decrease and product concentrations increase. The rate of change can be visualized using concentration vs. time graphs.
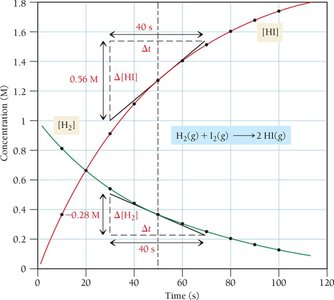
Instantaneous and Average Rate
The instantaneous rate is the rate at a specific moment, determined by the slope of the tangent to the concentration-time curve. The average rate is calculated over a finite time interval and is a linear approximation.
Instantaneous rate: Slope at a single point (first derivative).
Average rate: Slope over a time interval.
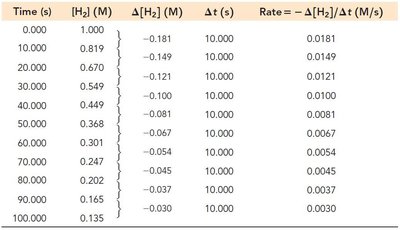
Tabular Data: Reaction Rate Calculation
The table below shows how the concentration of H2 changes over time and how the average rate is calculated.
Time (s) | [H2] (M) | Δ[H2] (M) | Δt (s) | Rate = -Δ[H2]/Δt (M/s) |
|---|---|---|---|---|
0.000 | 1.000 | -0.181 | 10.000 | 0.0181 |
10.000 | 0.819 | -0.149 | 10.000 | 0.0149 |
20.000 | 0.670 | -0.121 | 10.000 | 0.0121 |
30.000 | 0.549 | -0.100 | 10.000 | 0.0100 |
40.000 | 0.449 | -0.081 | 10.000 | 0.0081 |
50.000 | 0.368 | -0.067 | 10.000 | 0.0067 |
60.000 | 0.301 | -0.054 | 10.000 | 0.0054 |
70.000 | 0.247 | -0.045 | 10.000 | 0.0045 |
80.000 | 0.202 | -0.037 | 10.000 | 0.0037 |
90.000 | 0.165 | -0.030 | 10.000 | 0.0030 |
100.000 | 0.135 |
Reaction Rate Changes Over Time
Reaction rates typically decrease as reactant concentrations fall. Eventually, the reaction stops when reactants are depleted or equilibrium is reached.
Reaction Rate and Stoichiometry
For reactions with different stoichiometric coefficients, the rate of change for each substance is related to its coefficient. For the reaction , the rate is:

Example: Calculating Rate for Stoichiometry
For the reaction , if the initial rate is 0.100 M/s, the rate of change for [B] is:
Summary Table: Key Concepts
Concept | Definition | Formula |
|---|---|---|
Osmosis | Solvent flow from low to high solute concentration | |
Osmotic Pressure | Pressure to stop osmosis | |
Van’t Hoff Factor | Number of particles per formula unit | |
Reaction Rate | Speed of reactant consumption/product formation | |
Stoichiometry Rate | Rate adjusted for coefficients |
Additional info: Academic context was added to clarify the relationship between colligative properties, soap structure, and chemical kinetics, and to ensure completeness for exam preparation.
