 Back
BackEquilibrium Constant for the Formation of a Complex Ion: FeSCN²⁺
Study Guide - Smart Notes
 Tailored notes based on your materials, expanded with key definitions, examples, and context.
The Equilibrium Constant and Chemical Equilibrium
Introduction to Chemical Equilibrium
Chemical reactions often do not proceed to completion; instead, they reach a state where both reactants and products coexist in stable concentrations. This state is known as chemical equilibrium. At equilibrium, the forward and reverse reaction rates are equal, resulting in no net change in concentrations.
Equilibrium State: A stable mixture of reactants and products.
Reversible Reactions: Most reactions can proceed in both directions.
Equilibrium Constant (K): Quantifies the ratio of product to reactant concentrations at equilibrium.
Equilibrium Constant Expression
The equilibrium constant for a reaction is derived from its balanced equation. For a general reaction: The equilibrium constant expression is:
Kc: Used when concentrations are in molarity (mol/L).
Temperature Dependence: Kc is constant at a given temperature.
Example: Formation of FeSCN²⁺ Complex Ion
The reaction studied is: The equilibrium constant expression is:
FeSCN²⁺: Blood-red colored complex ion.
Fe³⁺: Pale yellow.
SCN⁻: Colorless.
Measuring FeSCN²⁺ Concentration: Spectrophotometry and Beer’s Law
Principle of Absorption Spectrophotometry
The concentration of FeSCN²⁺ is determined by measuring the intensity of its color using a spectrophotometer. The absorbance of light (A) is directly proportional to the concentration of the colored species, as described by Beer’s Law: Where:
A: Absorbance
E: Molar extinction coefficient (depends on species and wavelength)
L: Path length of light through solution (typically 1.0 cm)
C: Concentration of colored species
Choosing the Wavelength
The color observed is complementary to the color absorbed. FeSCN²⁺ appears orange-red, so it absorbs most strongly in the blue region (447 nm). 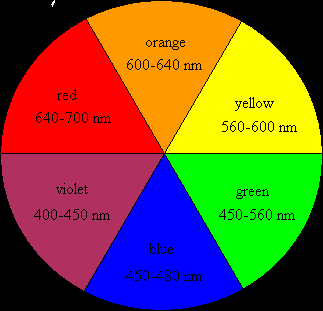
Spectrophotometer Operation
A spectrophotometer measures absorbance at a specific wavelength. The device consists of a light source, collimator, monochromator, wavelength selector, sample holder, detector, and digital display. 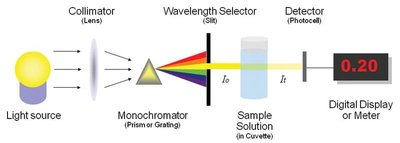
Blank: Used to zero the instrument.
Cuvette: Special container for sample solutions.
Calibration Curve and Standard Solutions
Creating Standard Solutions
Standard solutions of FeSCN²⁺ are prepared by mixing dilute KSCN with concentrated Fe(NO₃)₃, ensuring Fe³⁺ is in excess so all SCN⁻ reacts to form FeSCN²⁺. The concentration of FeSCN²⁺ in the first standard is approximated as the initial SCN⁻ concentration, diluted by all reagents. Subsequent standards are made by diluting the first with deionized water.
Calibration Curve
Absorbance values for standard solutions are plotted against their concentrations to create a calibration curve. The linear relationship allows determination of unknown concentrations from measured absorbance. 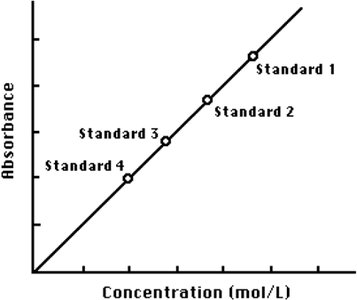
Equation of Line: Used to calculate FeSCN²⁺ concentration in equilibrium mixtures.
Calculating Equilibrium Concentrations and Kc
Initial and Equilibrium Concentrations
Initial Concentrations: Calculated using dilution formulas and provided molarity/volumes.
Equilibrium Concentrations: FeSCN²⁺ determined by spectrophotometry; Fe³⁺ and SCN⁻ calculated using an ICE table.
ICE Table Method
The ICE (Initial, Change, Equilibrium) table tracks concentration changes during the reaction:
Fe³⁺ | SCN⁻ | FeSCN²⁺ | |
|---|---|---|---|
Initial | [Fe³⁺]₀ | [SCN⁻]₀ | 0 |
Change | -x | -x | +x |
Equilibrium | [Fe³⁺]₀ - x | [SCN⁻]₀ - x | x |
x: Equilibrium concentration of FeSCN²⁺ (from absorbance).
Apply values to Kc expression to solve for the equilibrium constant.
Lab Techniques and Safety
Preparation and Measurement Procedures
Use volumetric and graduated pipets for accurate solution preparation.
Rinse pipets and cuvettes with deionized water before use.
Measure absorbance in reverse order (most dilute to most concentrated).
Use the same spectrophotometer for all measurements.
Safety Precautions
Wear safety goggles, lab coat, and nitrile gloves.
Handle iron(III) nitrate solutions with care; they contain corrosive nitric acid.
Dispose of all waste in designated containers; do not pour chemicals down the sink.
Summary Table: Preparation of Equilibrium Mixtures
Mixture | Fe(NO₃)₃ (2.00 x 10⁻³ M) | KSCN (2.00 x 10⁻³ M) | Deionized Water |
|---|---|---|---|
Mixture 1 | 5.00 mL | 5.00 mL | 0.00 mL |
Mixture 2 | 5.00 mL | 4.00 mL | 1.00 mL |
Mixture 3 | 5.00 mL | 3.00 mL | 2.00 mL |
Mixture 4 | 5.00 mL | 2.00 mL | 3.00 mL |
Summary Table: Standard Solution Dilutions
Standard | Standard 1 Solution | Deionized Water |
|---|---|---|
Standard 2 | 5.00 mL | 1.00 mL |
Standard 3 | 4.00 mL | 2.00 mL |
Standard 4 | 3.00 mL | 3.00 mL |
Conclusion
This experiment demonstrates the determination of the equilibrium constant for the formation of a complex ion using spectrophotometry. By preparing standard and equilibrium mixtures, measuring absorbance, and applying Beer’s Law and ICE tables, students can quantitatively analyze chemical equilibrium and reinforce key concepts in solution chemistry and equilibrium. Applications: This method is widely used in analytical chemistry for quantifying concentrations of colored species and studying equilibrium systems.
