 Back
BackGeneral Chemistry II: Key Diagrams and Their Relevance
Study Guide - Smart Notes
 Tailored notes based on your materials, expanded with key definitions, examples, and context.
Q1. Analyze the phase diagram and identify which statement about the diagram is not true.
Background
Topic: Phase Diagrams
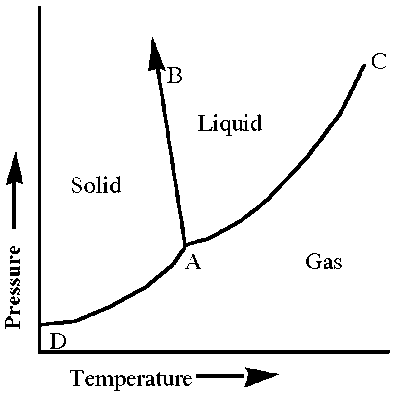
This question tests your understanding of phase diagrams, which show the stable phases (solid, liquid, gas) of a substance at different temperatures and pressures. You are expected to interpret the diagram and relate it to phase transitions and critical points.
Key Terms and Concepts:
Triple Point (A): The unique set of conditions where all three phases coexist in equilibrium.
Critical Point (C): The end point of the liquid-gas boundary, beyond which the liquid and gas phases are indistinguishable.
Phase Boundaries: Lines separating solid, liquid, and gas regions, representing equilibrium between two phases.
Phase Transitions: Melting, freezing, vaporization, condensation, sublimation, and deposition.
Step-by-Step Guidance
Examine the labeled points and lines on the diagram. Identify which lines represent phase boundaries (solid-liquid, liquid-gas, solid-gas).
Recall what happens to a substance when you increase or decrease pressure or temperature at constant temperature or pressure, respectively.
Think about the physical meaning of each labeled point (A, B, C, D) and what phase transitions occur at those points or along those lines.
Review the typical behavior of substances on a phase diagram, such as the effect of increasing pressure on melting or sublimation, and the meaning of the critical point.
Try solving on your own before revealing the answer!
Final Answer:
The false statement is: "Increasing pressure at constant temperature can cause liquid to freeze."
On most phase diagrams, increasing pressure at constant temperature can cause a gas to condense or a solid to melt, but not a liquid to freeze. Freezing typically occurs by lowering temperature at constant pressure.
Q2. For the reaction diagram shown, which of the following is not true?
Background
Topic: Reaction Energy Diagrams
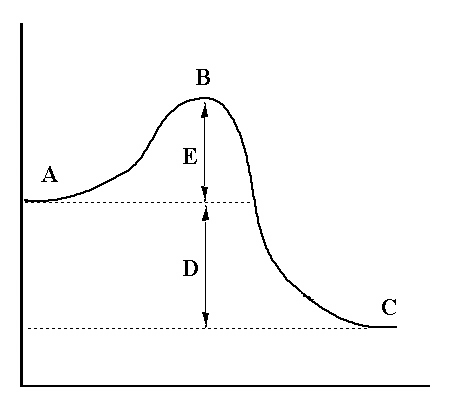
This question tests your ability to interpret a reaction coordinate diagram, which shows the energy changes during a chemical reaction, including reactants, products, transition state, activation energy, and enthalpy change.
Key Terms and Concepts:
Reactants (A): Starting materials of the reaction.
Products (C): Substances formed as a result of the reaction.
Transition State (B): The highest energy point along the reaction path.
Activation Energy (D): The energy difference between reactants and the transition state.
Enthalpy Change (E): The energy difference between reactants and products (ΔH).
Step-by-Step Guidance
Identify each labeled point on the diagram and match it to its role (reactant, product, transition state).
Determine which arrows represent activation energy and enthalpy change.
Recall the definitions of exothermic and endothermic reactions and how they appear on energy diagrams.
Check each statement about the diagram and see if it matches the diagram's features.
Try solving on your own before revealing the answer!
Final Answer:
The incorrect statement is: "D represents activation energy; E represents ΔH for the reaction."
In the diagram, D is the enthalpy change (ΔH), and E is the activation energy. The labels are swapped in the statement.
Q3. Which titration curve could describe the titration of a solution of HCl by addition of a solution of KOH?
Background
Topic: Acid-Base Titration Curves
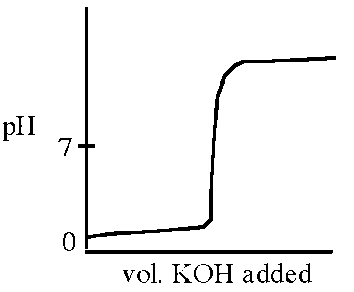
This question tests your ability to recognize the titration curve for a strong acid (HCl) with a strong base (KOH). The pH changes rapidly near the equivalence point, and the equivalence point is at pH 7.
Key Terms and Concepts:
Strong Acid-Strong Base Titration: The pH starts low, rises sharply at the equivalence point (pH 7), and then levels off at high pH.
Equivalence Point: The point where moles of acid equal moles of base; for strong acid-strong base, pH = 7.
Step-by-Step Guidance
Recall the general shape of a strong acid-strong base titration curve: low initial pH, sharp rise at equivalence, and high final pH.
Compare the provided curves and identify which one matches this description.
Check the pH at the equivalence point to confirm it is around 7.
Try solving on your own before revealing the answer!
Final Answer:
The correct titration curve is the one that starts at low pH, rises sharply at the equivalence point (pH 7), and then levels off at high pH (image_4).
This matches the expected behavior for titrating a strong acid with a strong base.
